September '25 Market Update
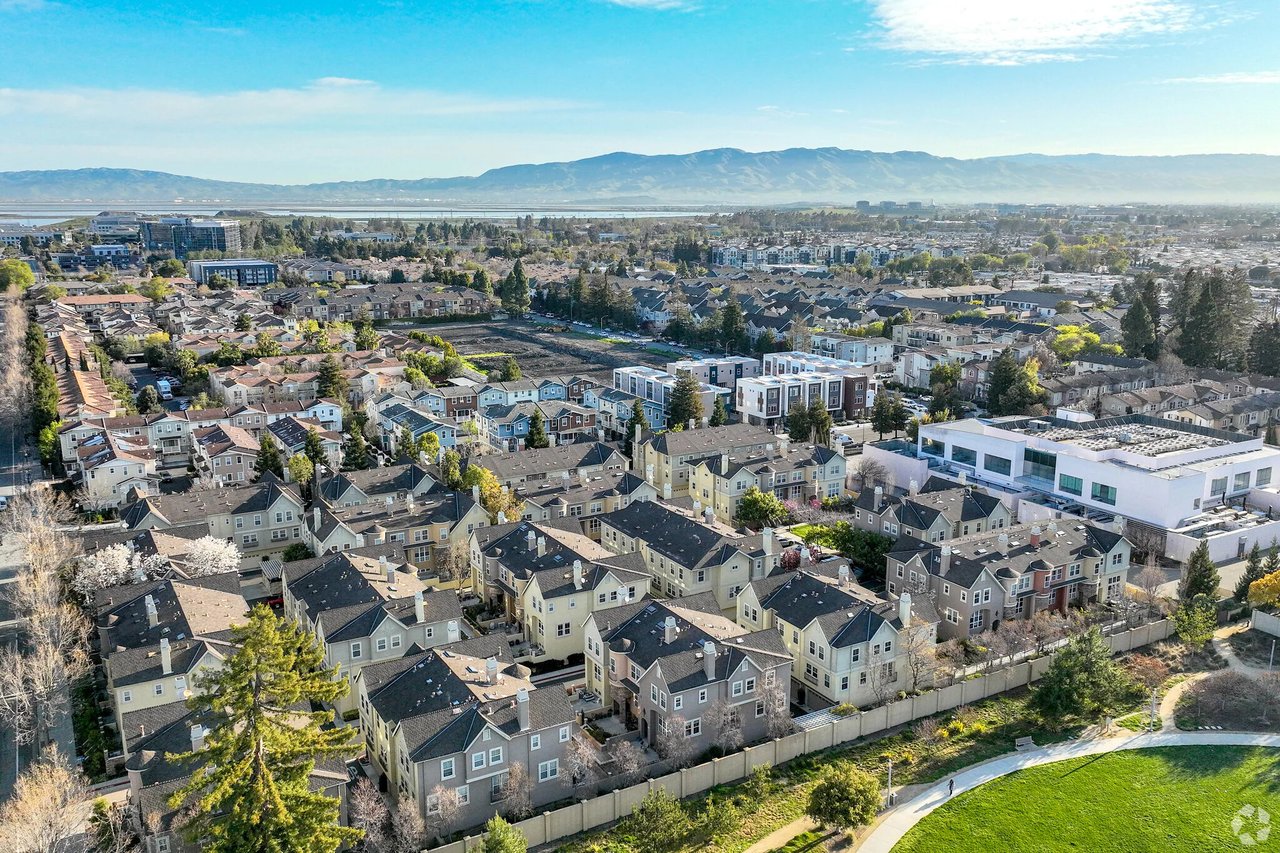
Aerial view of a suburban neighborhood, with water and mountains in the distance.

What’s Happening in the Bay Area Real Estate Market

💰 Median Monthly Payments Remain High

The typical homeowner is paying about $2,235/month for principal and interest. High interest rates and steady home prices are keeping costs elevated.

📉 Are Rate Cuts on the Horizon?

Fed Chair Jerome Powell hinted at rate cuts coming soon. Lower rates would ease payments and could boost the housing market. Buyers who purchase now may benefit twice: securing a home before prices rise and refinancing later at lower rates.

📊 Mortgage Rates Already Trending Down

Mortgage rates recently dipped to about 6.35% after being higher in July and August. This drop reflects optimism that the Fed will begin cutting rates, with more decreases likely ahead.

🏡 Inventory Levels and Market Impact

Housing inventory is still elevated compared to last year. But if rates keep falling, more buyers may step in, reducing supply and potentially driving prices upward again.

Line chart of existing home sales and inventory from July 2024 to July 2025; inventory rises toward July.

Line chart of Federal Reserve mortgage-backed securities holdings, peaking in 2022 before declining through 2025.

Bar chart of median monthly principal and interest payments, peaking at $2,311 in June 2025.

Chart of monthly U.S. home prices and 30-year mortgage rates from July 2024 to July 2025.

Chart of monthly U.S. new listings from August 2018 to August 2025, fluctuating between roughly 215,000 and 585,000.

LOCAL LOWDOWN

SILICON VALLEY

Chart of San Francisco single-family home listings, with monthly new and sold listings and homes for sale from August 2023 to August 2025.

Chart of Silicon Valley condo listings, with monthly new and sold listings and listings for sale from August 2023 to August 2025.

Chart comparing monthly Silicon Valley single-family home new listings, sold listings, and listings for sale, August 2023–August 2025.

Chart of year-over-year Silicon Valley single-family home median price changes by county, September 2024 to August 2025.

Chart comparing monthly median single-family home prices in San Mateo, Santa Clara, and Santa Cruz, 2022–2025.

NORTH BAY & EAST BAY

Line chart comparing median single-family home prices in four North Bay counties from August 2022 to August 2025.

North Bay single-family home price changes by county, September 2024–August 2025.

North Bay single-family home inventory chart comparing new listings, sold listings, and homes for sale by month.

Chart of year-over-year median condo price changes across four North Bay counties, September 2024–August 2025; Napa spikes in February.

Line chart comparing monthly days on market for single-family homes in four North Bay counties, August 2023–August 2025.

North Bay condo inventory chart comparing monthly new, sold, and for-sale listings from August 2023 to August 2025.

Line chart comparing monthly days on market for single-family homes in Alameda and Contra Costa counties, August 2023–August 2025.

Line chart comparing monthly condo days on market in Alameda and Contra Costa, August 2023–August 2025.

Chart of East Bay single-family listings, with new, sold, and for-sale inventory from August 2023 to August 2025.

Chart of East Bay condo inventory, with monthly new and sold listings and listings for sale from August 2023 to August 2025.

Bar chart comparing year-over-year median single-family home price changes in Alameda and Contra Costa counties.

Chart of year-over-year East Bay single-family home price changes in Alameda and Contra Costa, September 2024–August 2025.

East Bay single-family home supply chart comparing Alameda and Contra Costa, August 2023 to August 2025.

Line chart of monthly East Bay single-family home prices in Alameda and Contra Costa, August 2022–August 2025.


Let's Talk

You’ve got questions and we can’t wait to answer them.

Set Up Your Search for New Homes

Check It Out