Why Bay Area Home Prices Are Rising While the National Market Cools

The national housing market continued to cool in October, but here in the Bay Area, single-family homes told a different story. While higher mortgage rates slowed sales across the country, Bay Area home prices climbed, inventory remained tight, and desirable properties continued to move quickly.
So, is the market cooling or staying competitive? It depends on where you're looking.
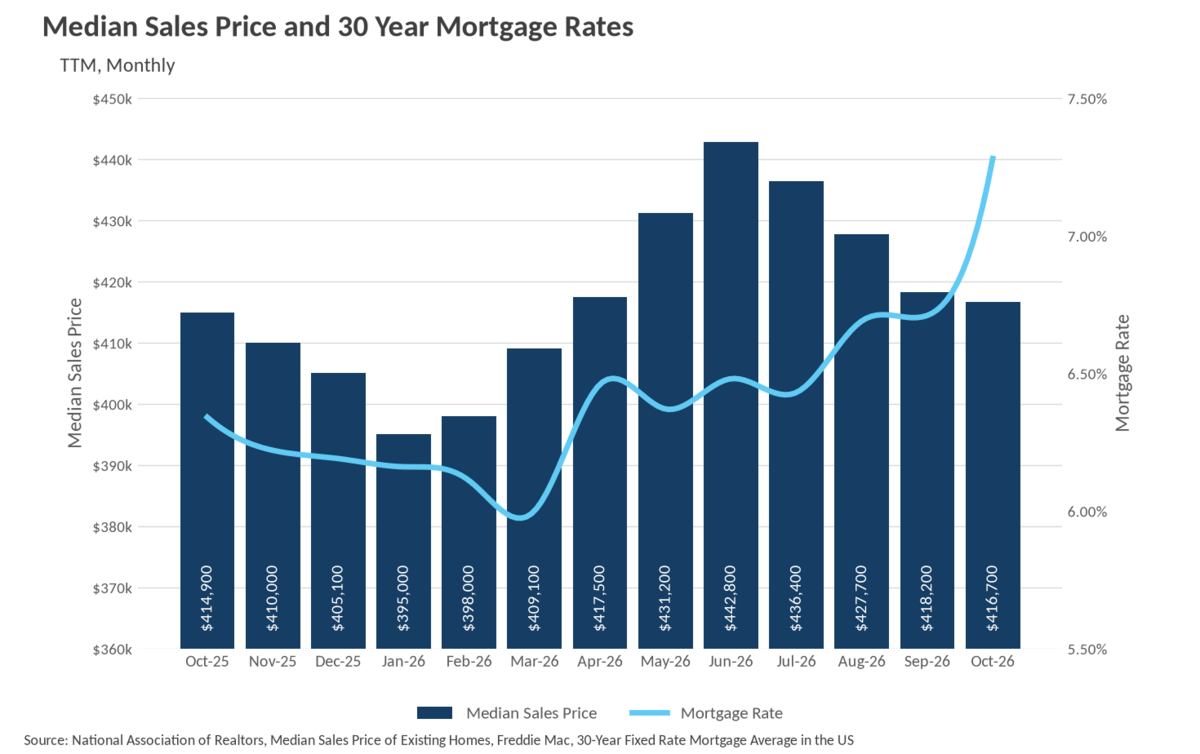
National home prices declined for a fourth consecutive month in October, but affordability remained a challenge as mortgage rates climbed.
Here's what stood out:
Interestingly, new listings declined 9.51% from September. This suggests inventory is increasing partly because homes are taking longer to sell, rather than because more sellers are entering the market.
What it means: Buyers may have more options nationally, but lower home prices don't automatically mean lower monthly payments.
October brought widespread price gains across the Bay Area, with San Francisco leading the way and Silicon Valley showing continued strength.
October Single-Family Home Prices:
Santa Clara County also saw a 7.89% increase from September, reaching its highest median single-family price since April. These numbers highlight the strength of the local market, although individual neighborhoods and price points may behave differently.
[Chart: Silicon Valley Median Single-Family Prices]
While national inventory increased, much of the Bay Area experienced the opposite.
Single-Family Inventory Changes:
Days on Market:
What it means: Limited inventory continues to support competition for desirable single-family homes. Even during the slower fall season, buyers shouldn't assume every property will sit on the market.
[Chart: Silicon Valley Single-Family Inventory]
Months of supply measures how long available inventory would take to sell at the current sales pace. Around three months is often used as a benchmark for a balanced California market.
October Single-Family Months of Supply:
With supply below three months in these markets, sellers generally continue to hold an advantage. However, that doesn't guarantee every home will sell quickly or above asking price. Strategic pricing, preparation, and presentation still make a difference.
Stay up to date on the latest real estate trends.
November 21, 2026

November 19, 2026

November 19, 2026

November 19, 2026

November 12, 2026
November 5, 2026

October 29, 2026
October 23, 2026

October 22, 2026
What a Home Inspection Can and Cannot Tell You Before You Buy
You’ve got questions and we can’t wait to answer them.