Leave a Message

Thank you for your message. We will be in touch with you shortly.

June '25 Market Update

June '25 Market Update

THE BIG STORY

Quick Take:
  • Although affordability has been improving over the past few months, monthly P&I payments are still quite a bit higher than they were last year.
  • Despite political moves that some believe were designed to bring down interest rates, mortgage rates remain high, as the lending market prices in future uncertainty.
  • On a national level, inventories are increasing at a very rapid rate, while the number of homes sold has declined.
  • Over the past couple of months, the macroeconomic environment has been incredibly unpredictable, a trend which looks like it will continue over the coming months.

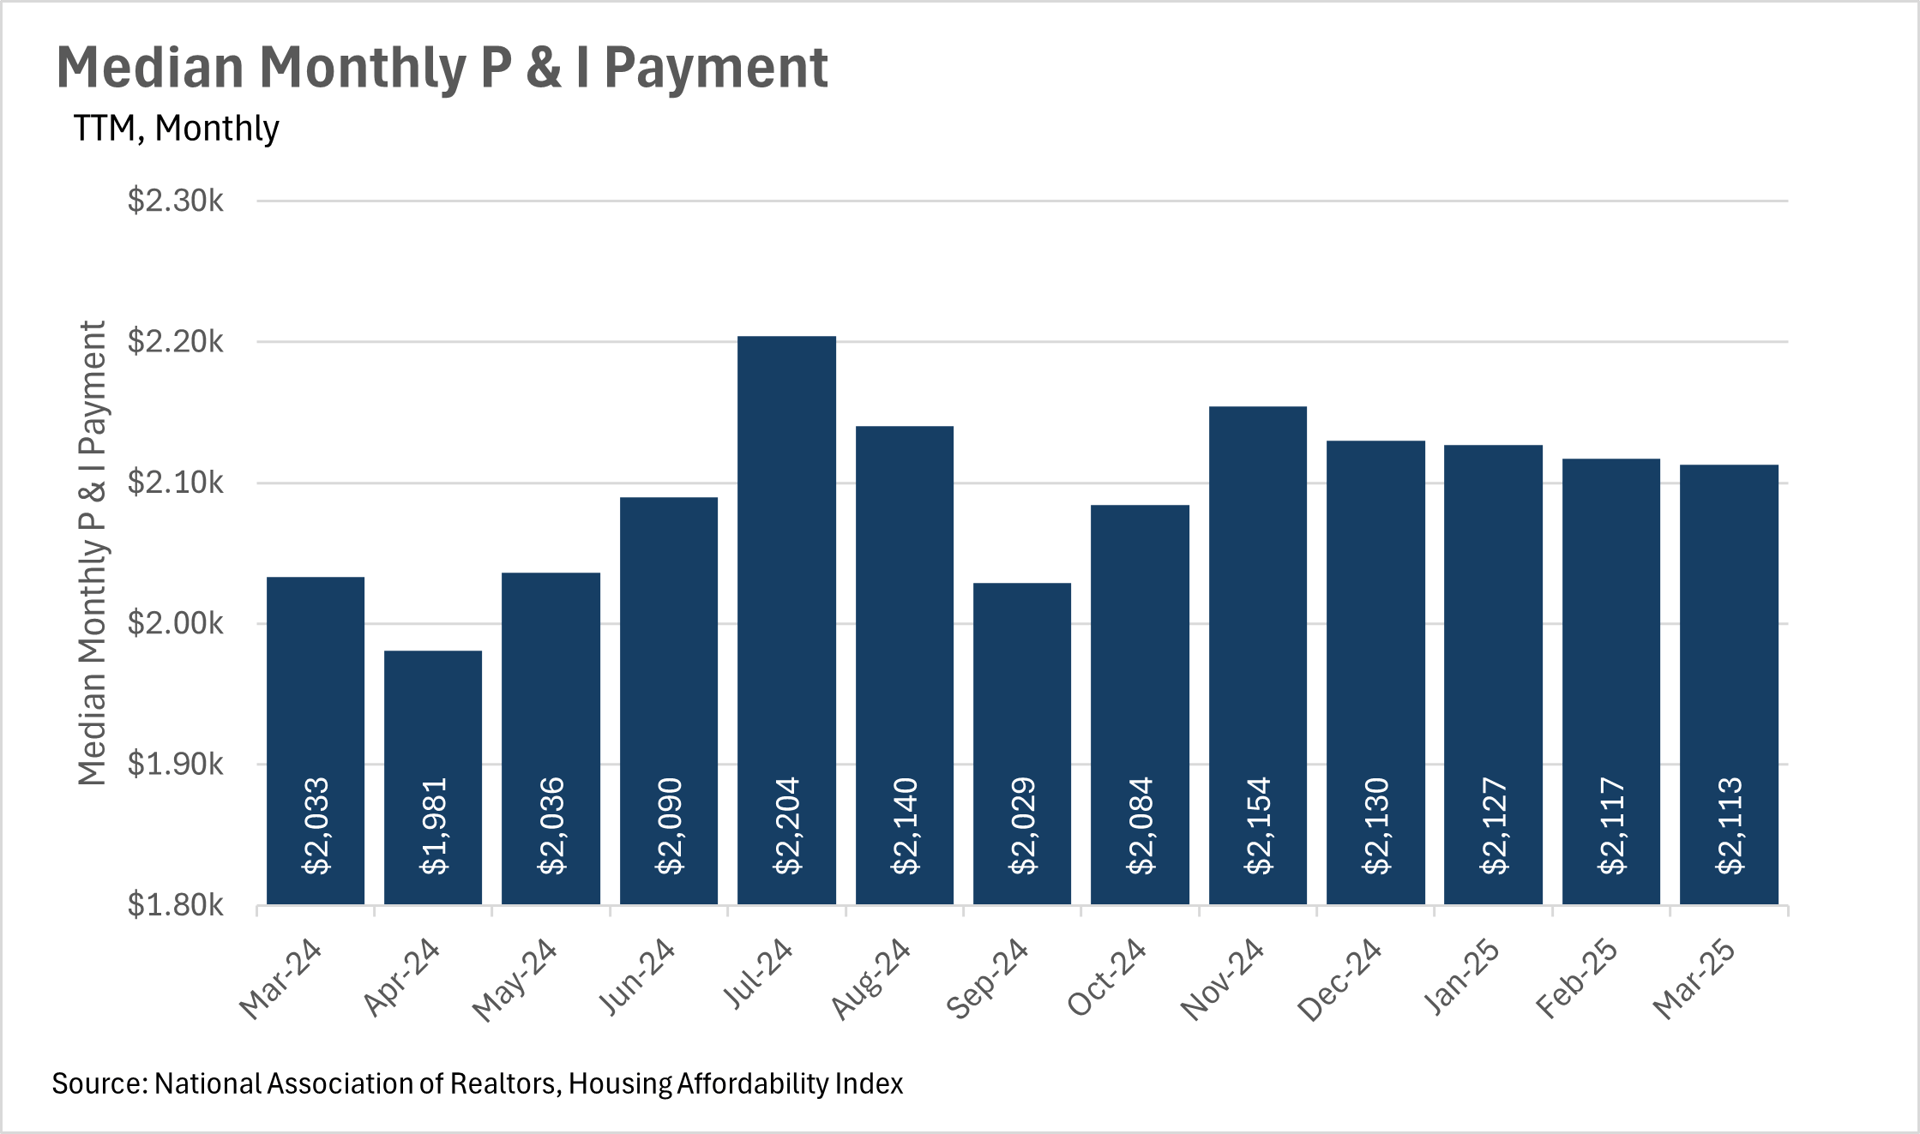
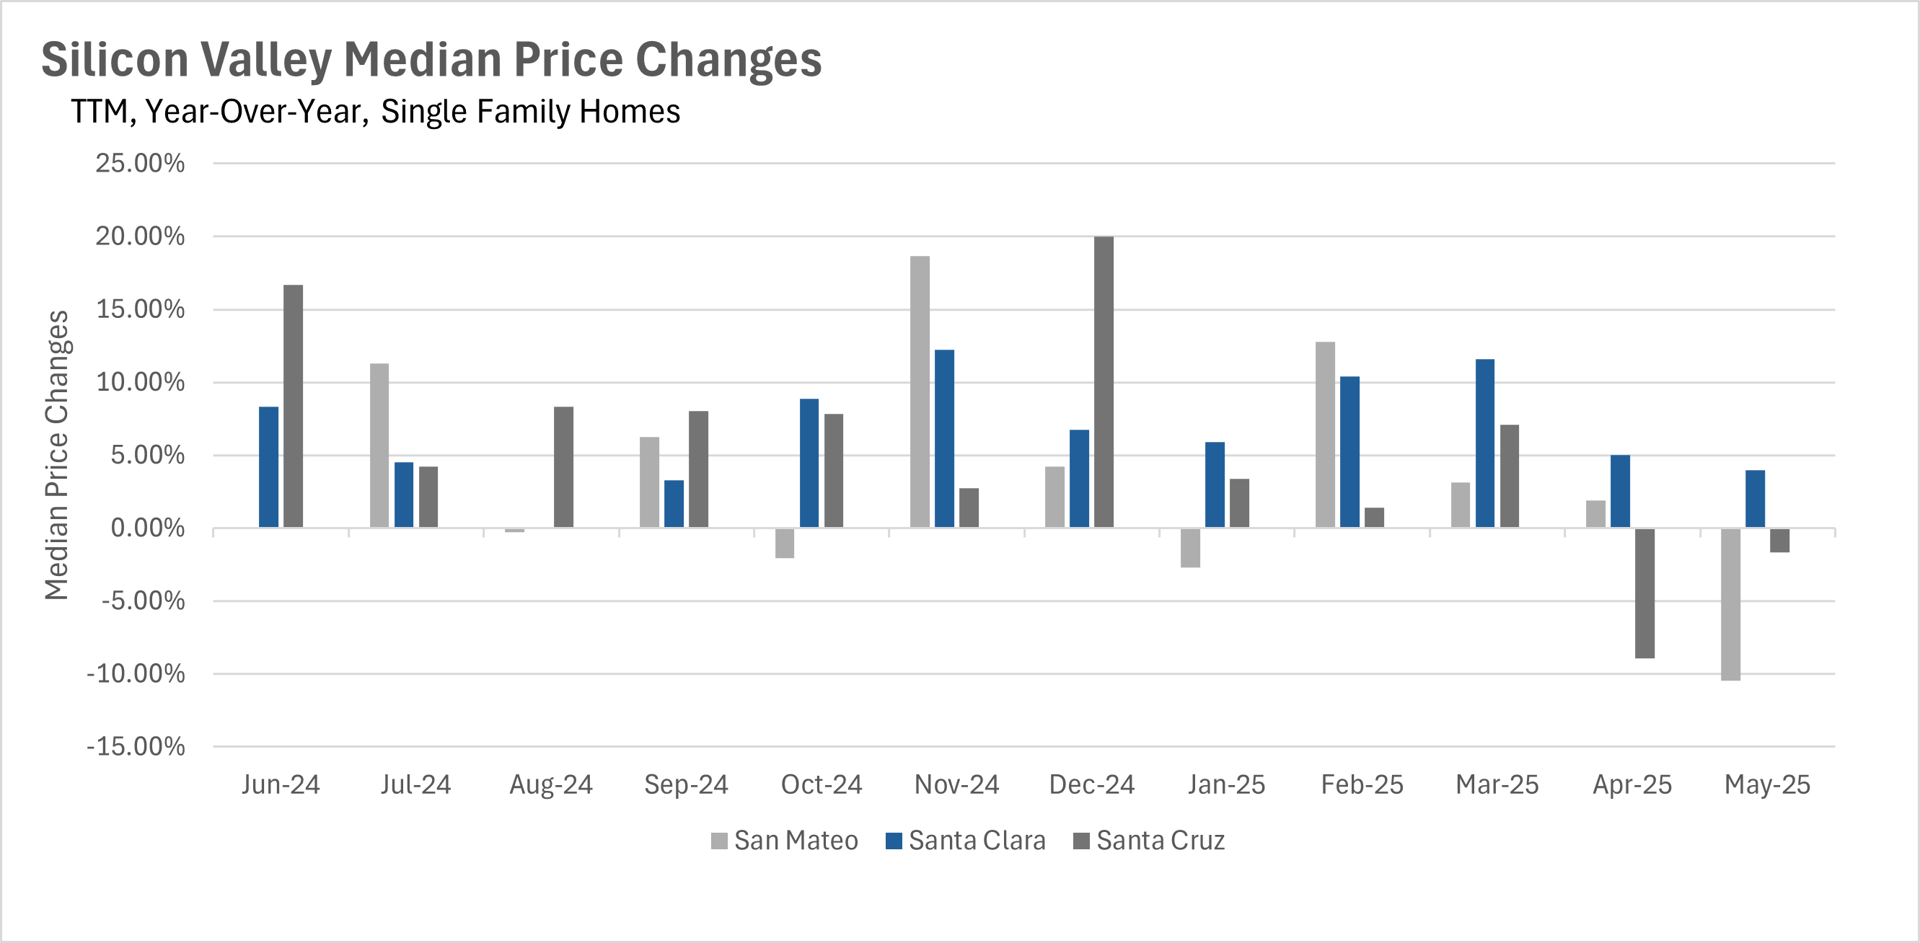
GROWTH IN MEDIAN MONTHLY P&I PAYMENTS CONTINUES TO OUTSTRIP INFLATION 

For quite some time, we’ve seen monthly inflation readouts with figures in the 2-3% range. Despite the fact that inflation seems to be under wraps for now, the median monthly P&I payment has grown faster than inflation, with the most reading coming in at $2,113, representing a 3.94% increase on a year-over-year basis. This shows that there are still inflationary pressures at work in the housing market.
 
Factors contributing to this inflation will vary by market. Some markets have more of an issue on the supply side (i.e. higher construction/materials costs), while others have an issue with the demand side (i.e. more demand for homes than supply). It will be especially important to pay attention to this metric over the coming months to get a gauge of how inflation is impacting the housing market.

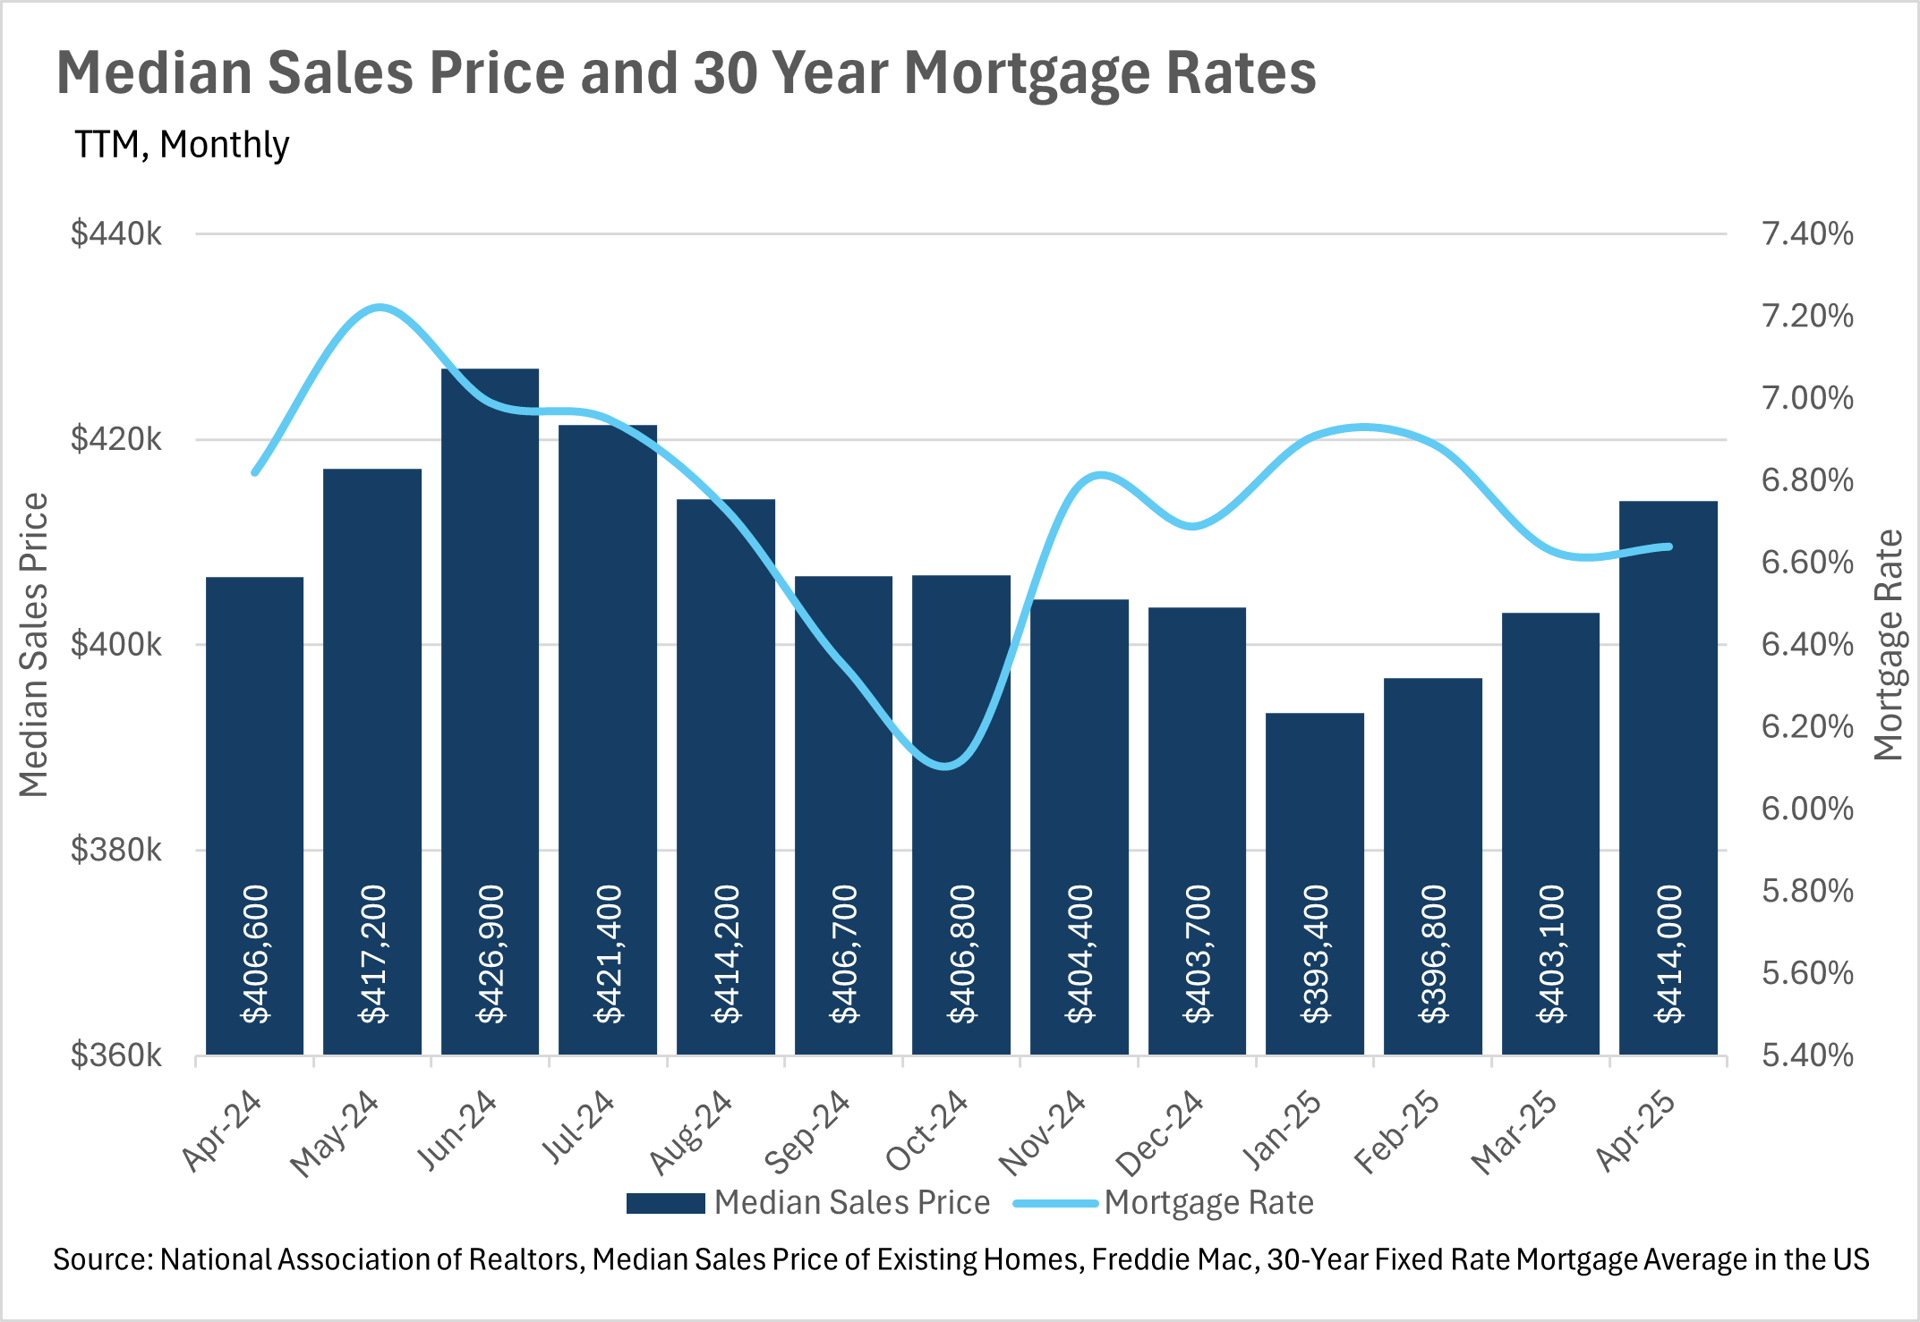
MORTGAGE RATES REMAIN HIGH, DESPITE LOOMING ECONOMIC UNCERTAINTY

Mortgage rates have remained high, in the mid to high-6% range for quite some time. Some believe that the recent trade war was being implemented in part to bring down interest rates. However, judging by recent commentary from the Fed, the trade war and the associated uncertainty, has only made Fed officials more cautious in utilizing the incredibly powerful economic tool that is the federal funds rate.
 
This means that we are probably going to see elevated mortgage rates for the foreseeable future, unless the economy takes a considerable turn for the worse. It is worth noting though, that according to the Fed’s “Dot Plot”, the majority of Federal Reserve officials predict the federal funds rate will be in the 3.75-4.00% range by the end of the year, and the 3.25-3.50% range in 2026.
 
 INVENTORIES CONTINUE TO BUILD ACROSS THE COUNTRY

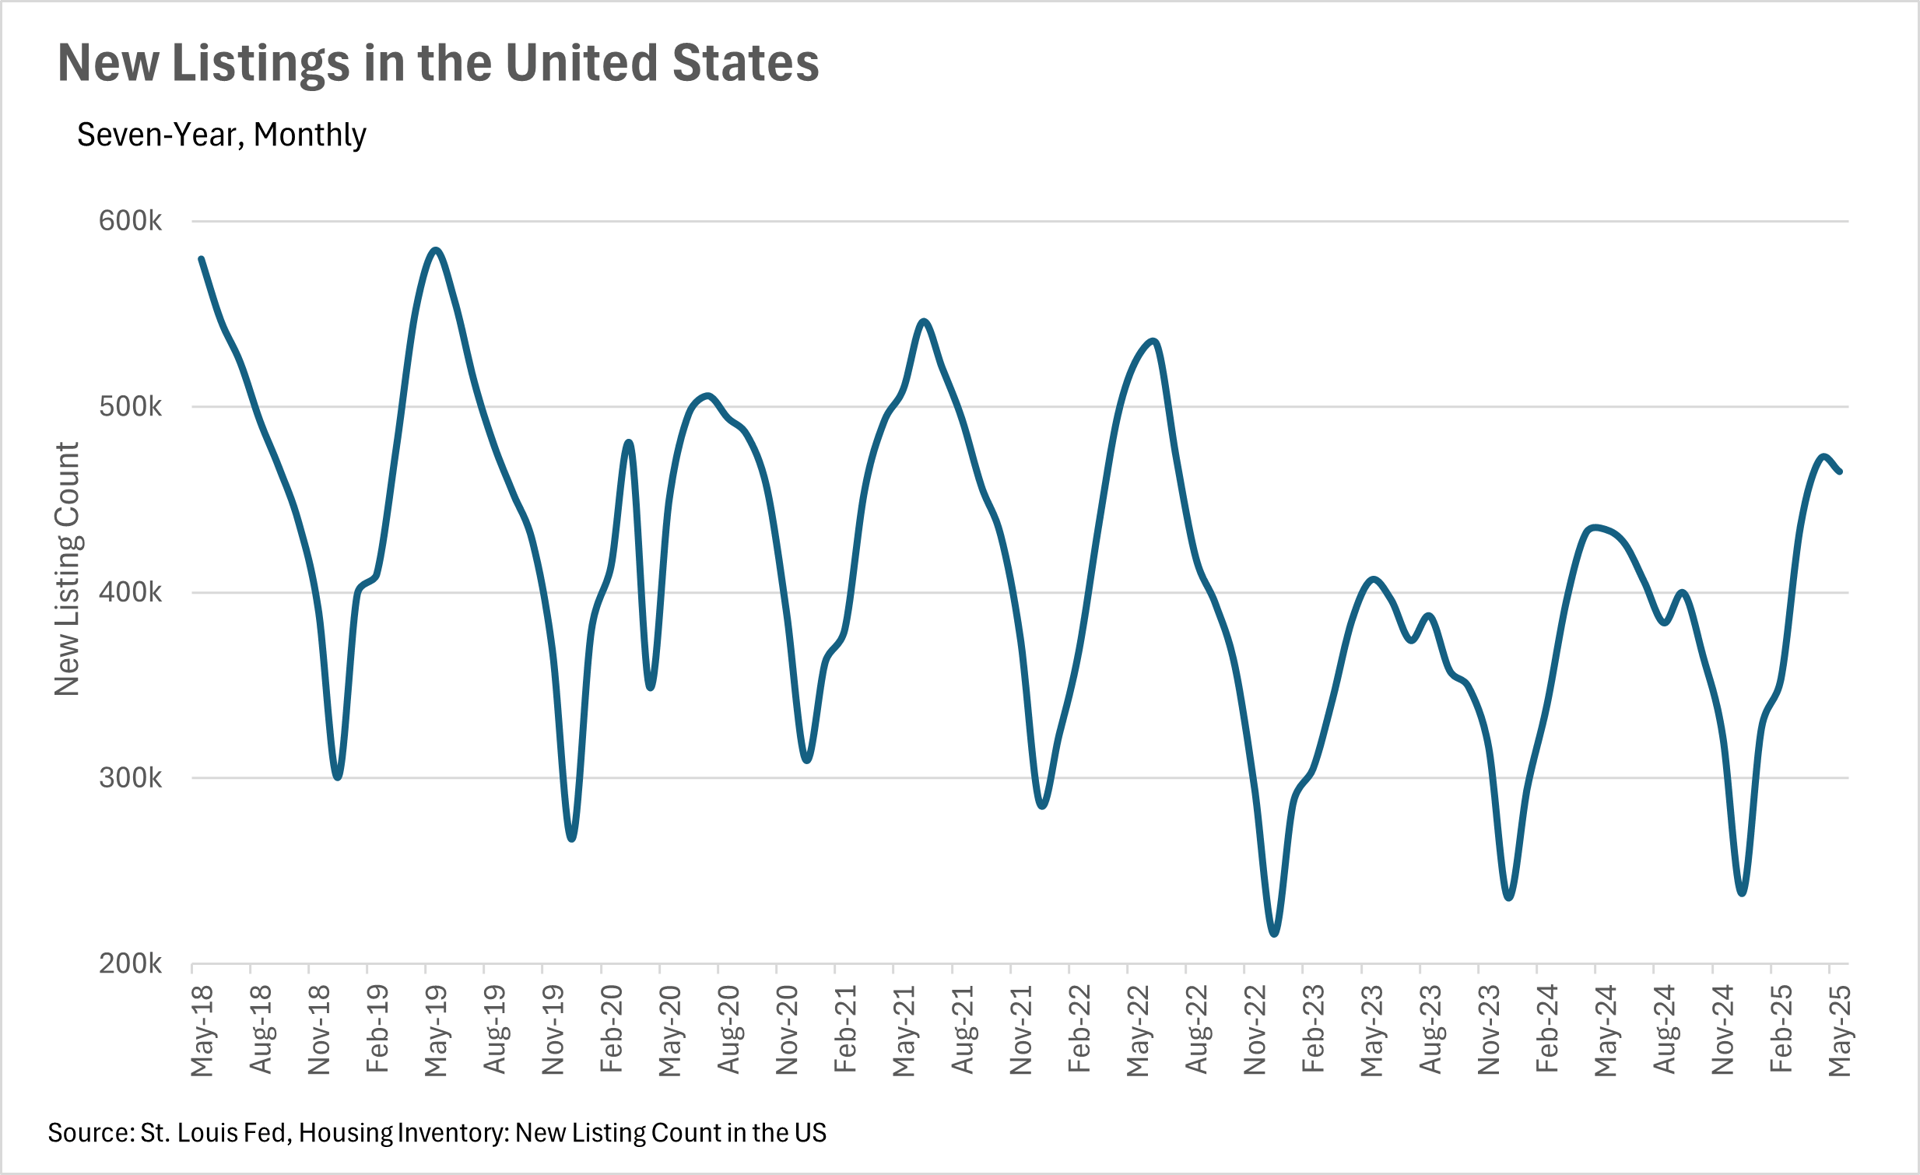
Nationally, the US housing market in April 2025 mirrored California's trends:

  • Inventory is up significantly, increasing 20.83% year-over-year to 1,450,000 units, meaning homes are staying on the market longer.
  • Existing home sales have declined, dropping 3.38% to 4,000,000 units.
  • Despite more homes available and fewer sales, median sale prices are still rising, up 1.82% year-over-year to $414,000.
  • New listings are also increasing, up 7.19% year-over-year.
BIG STORY DATA
 
 
THE LOCAL LOWDOWN
Quick Take:
  • Bay Area real estate markets show stark contrasts in May, with San Francisco surging while Silicon Valley's growth streak breaks and North Bay prices decline.
  • Inventory dynamics vary dramatically across regions, East Bay and Silicon Valley see massive increases while San Francisco and North Bay experience sharp declines.
  • The region's housing markets are increasingly polarized, with single-family homes generally favoring sellers while condo markets present significant opportunities for buyers.
  • Despite varying market conditions, homes are selling relatively quickly throughout most of the Bay Area, though condos are taking considerably longer in some areas.

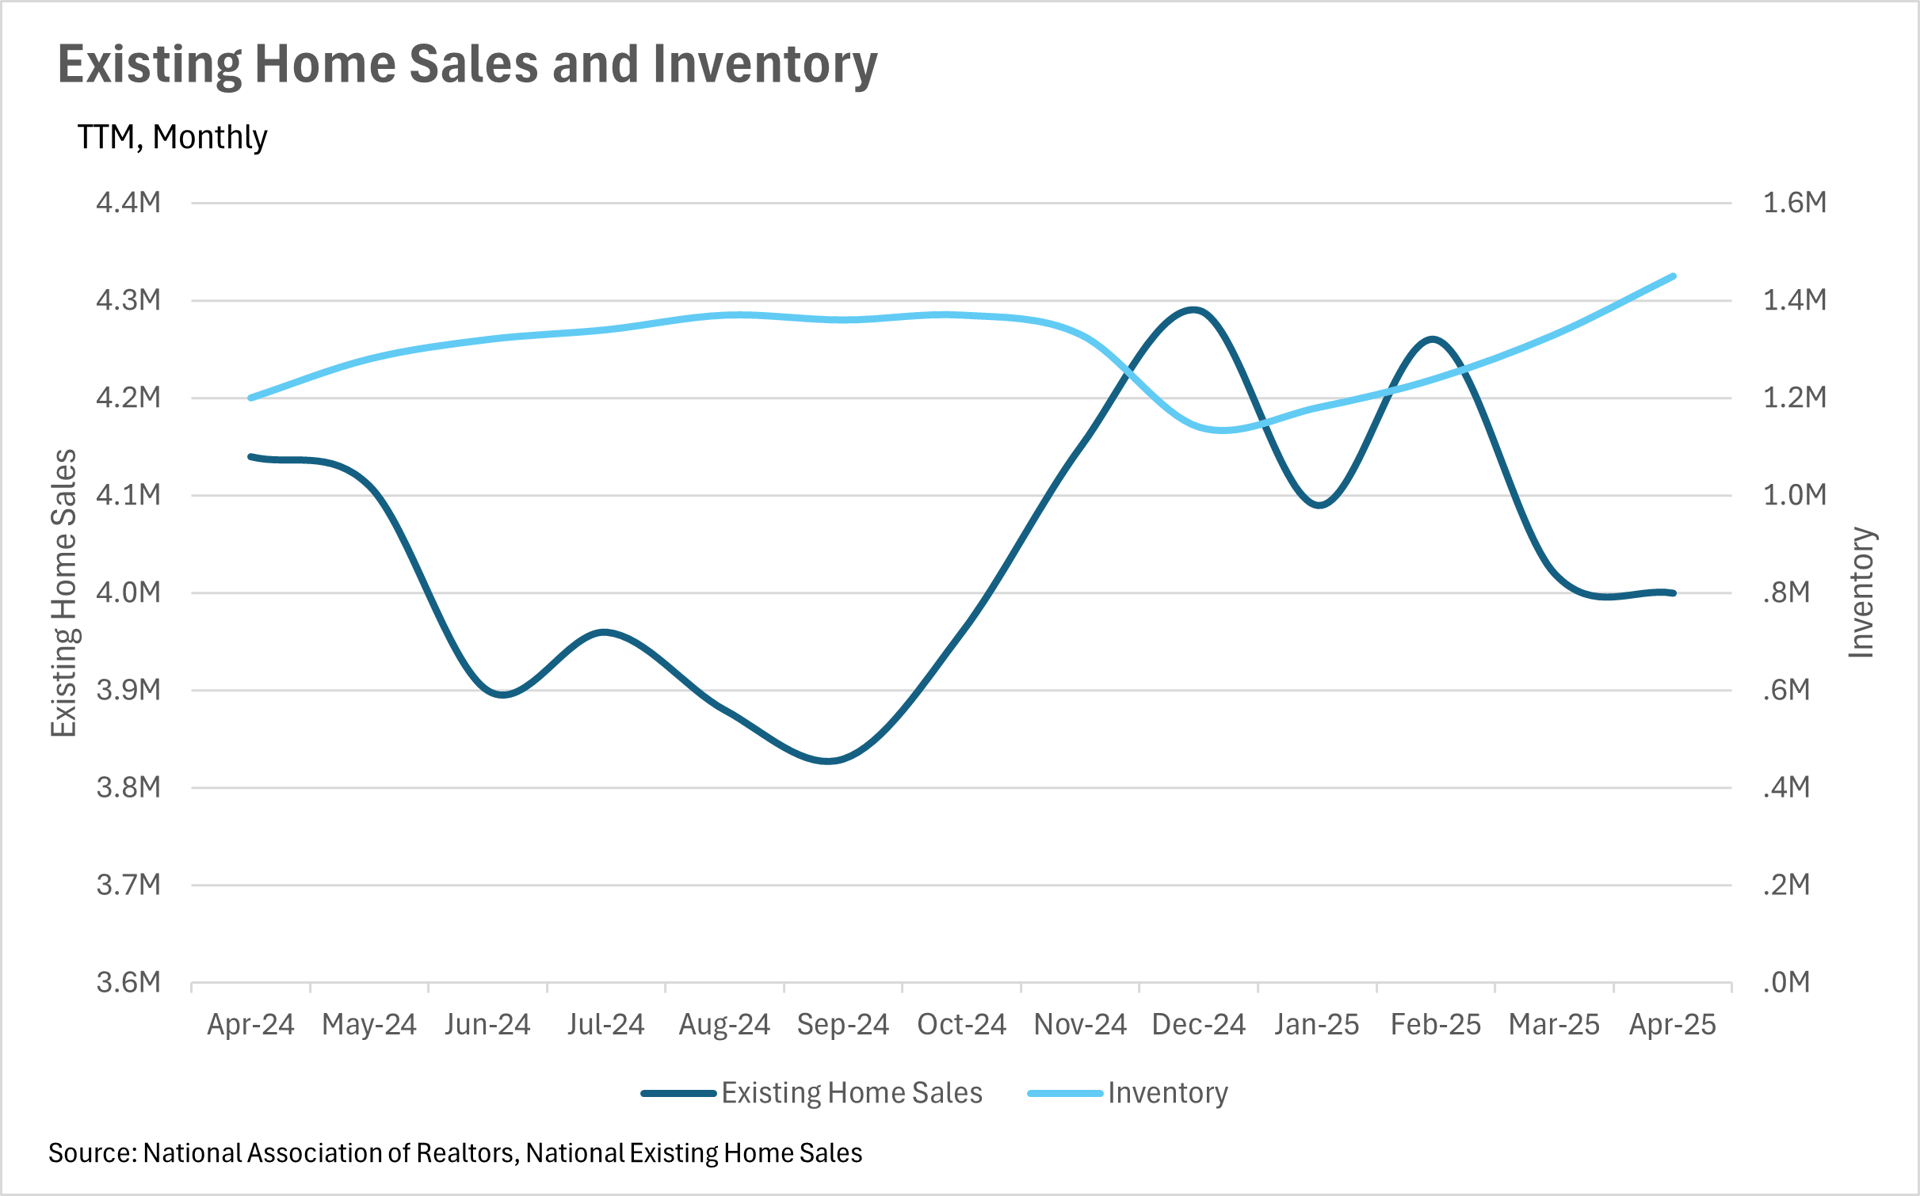
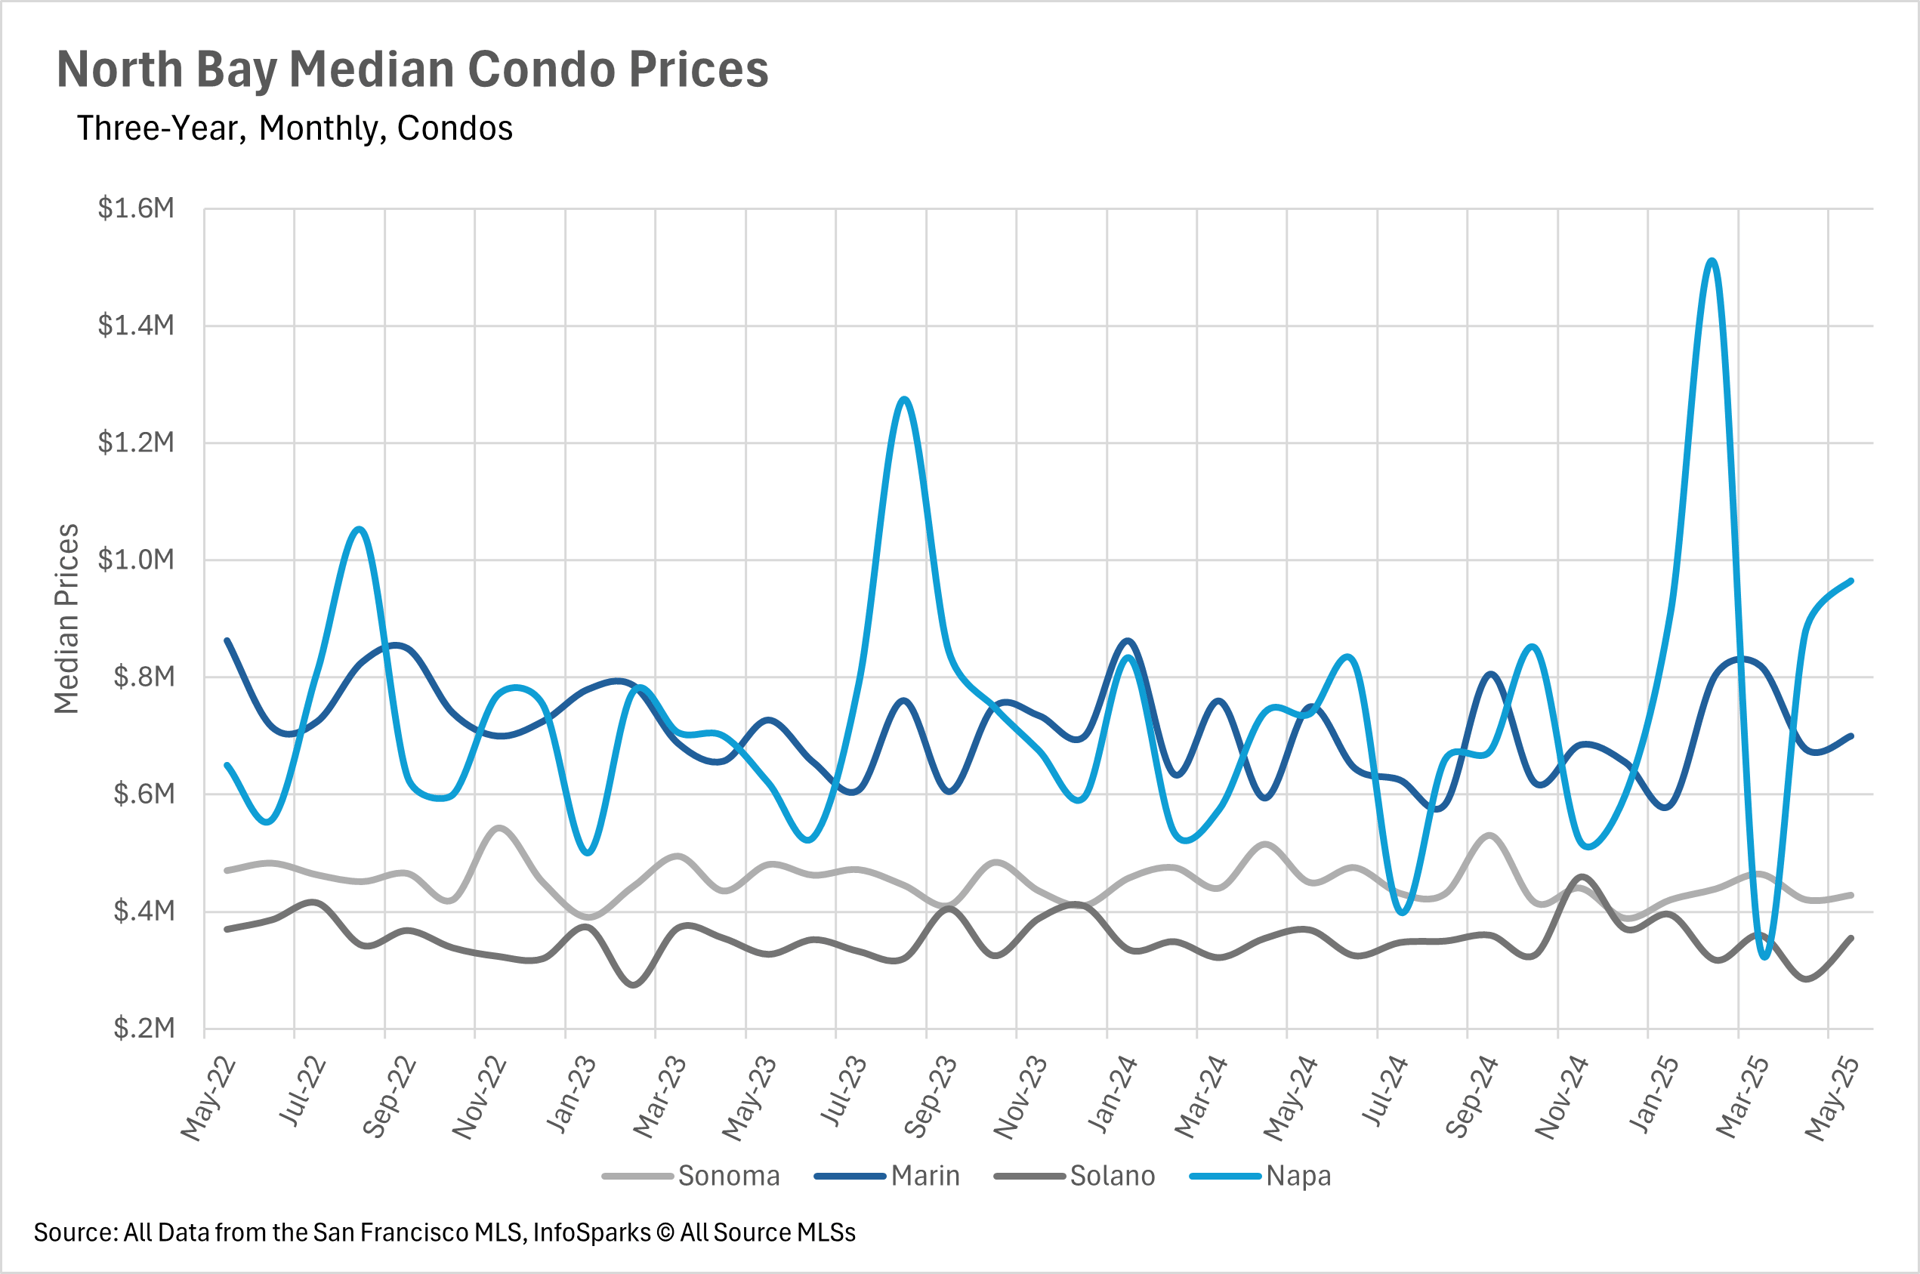
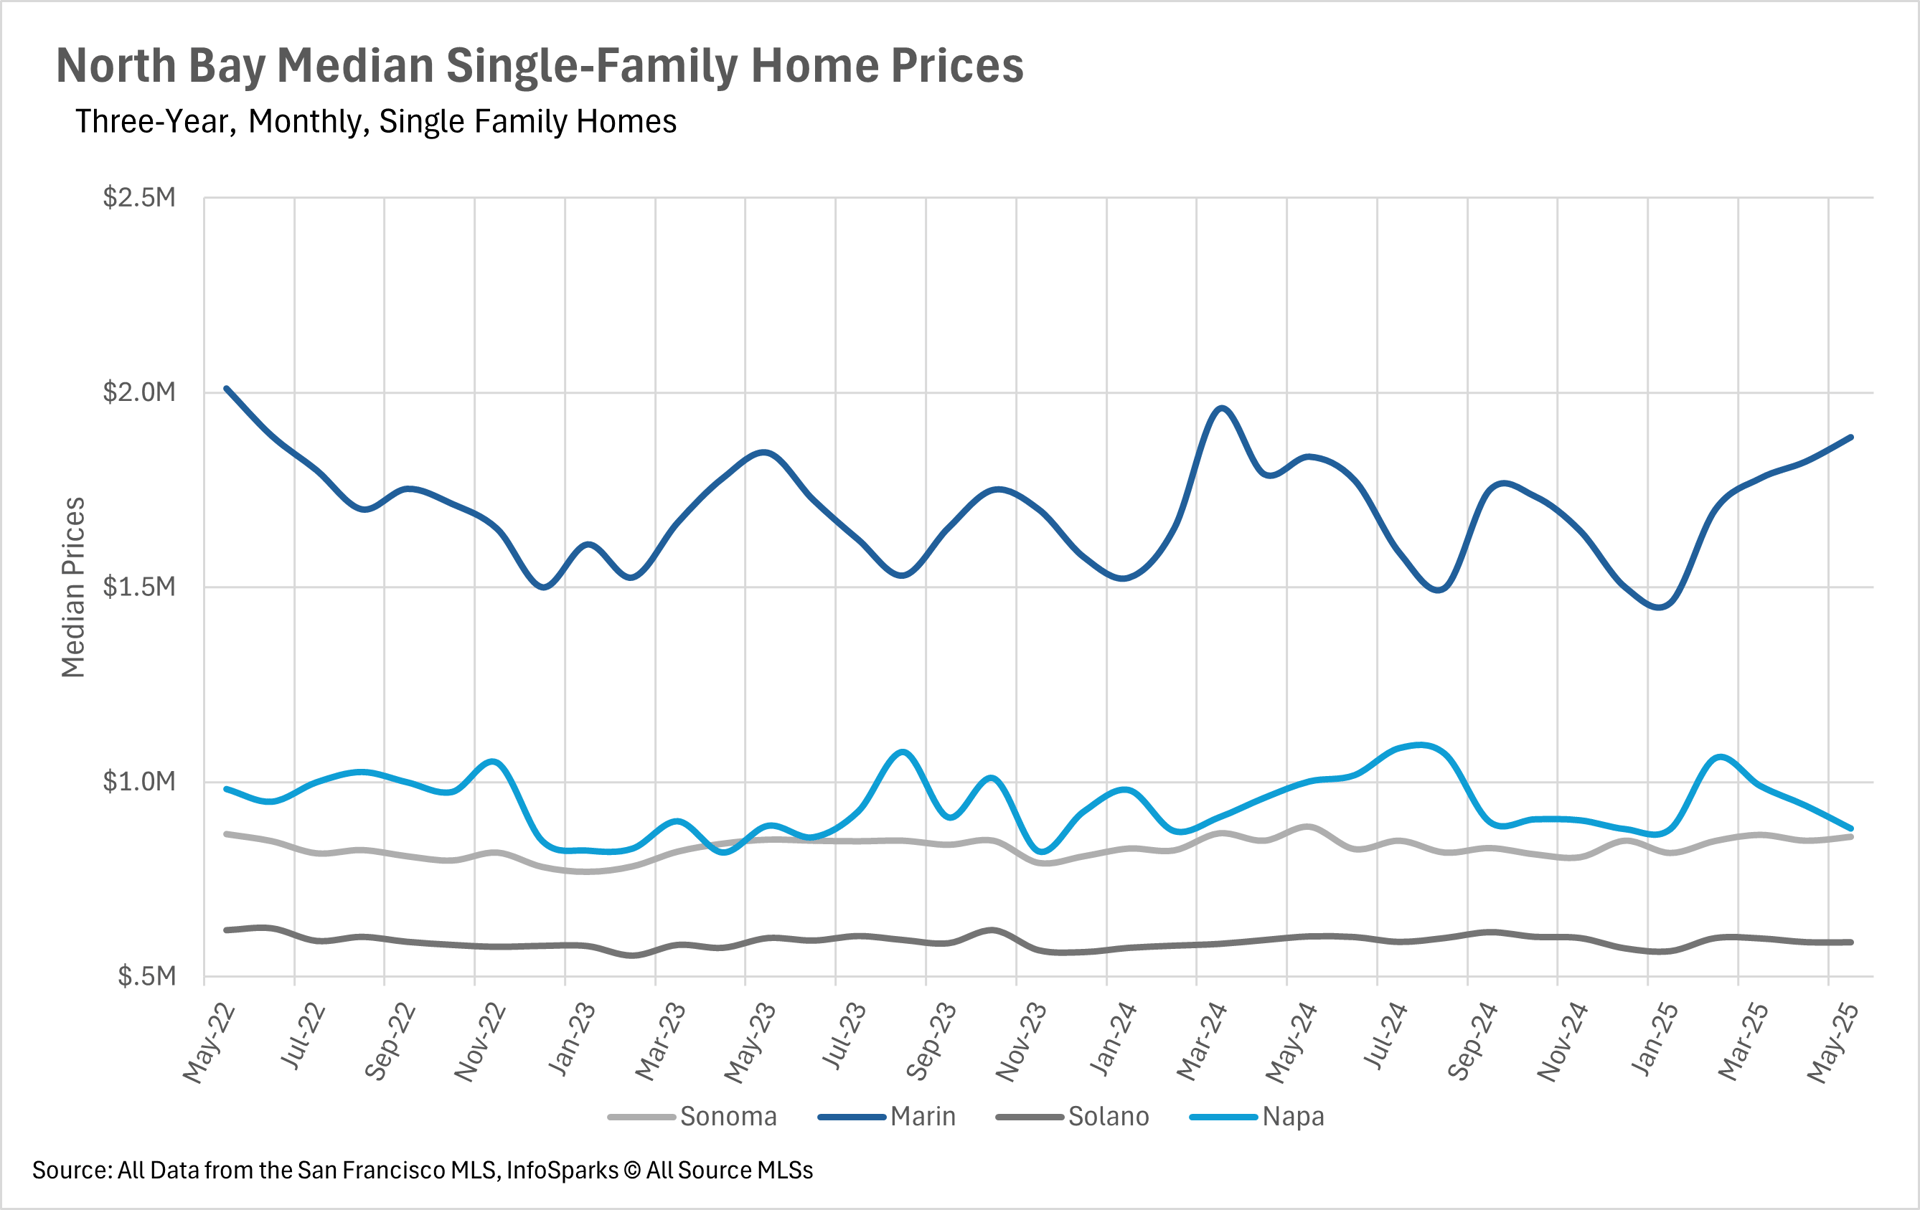
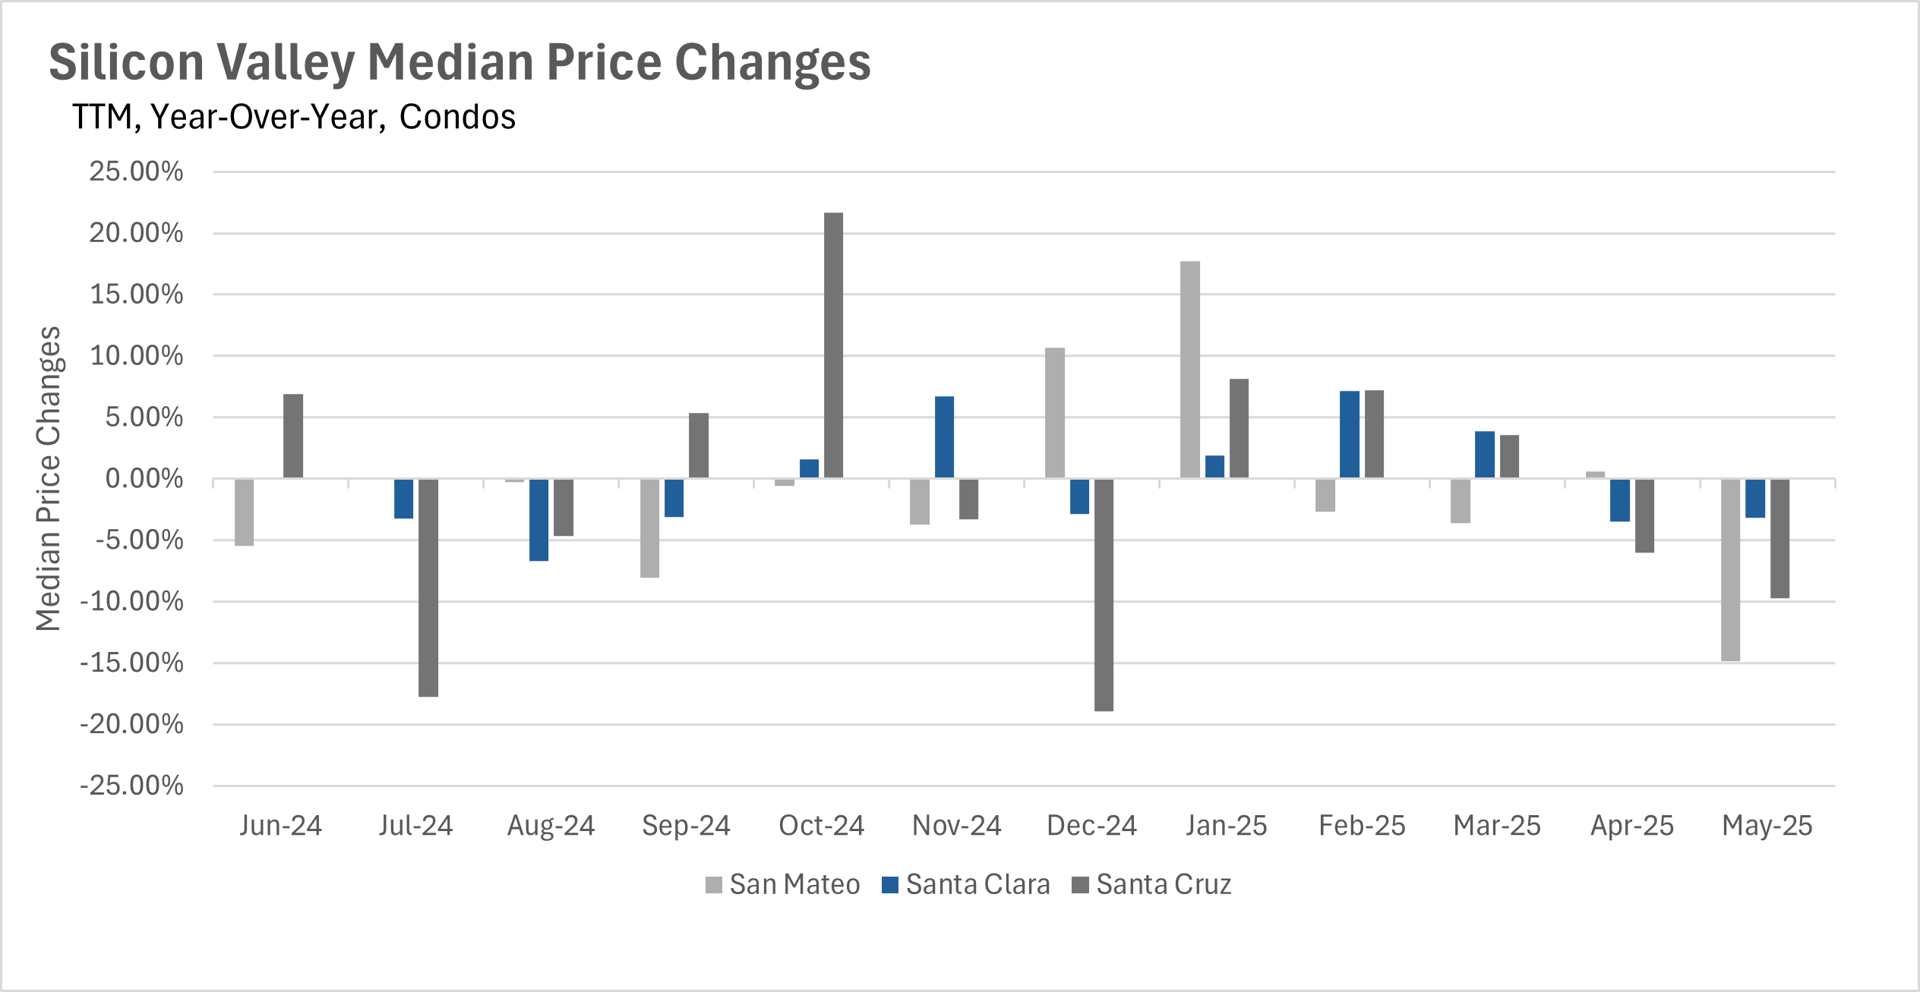
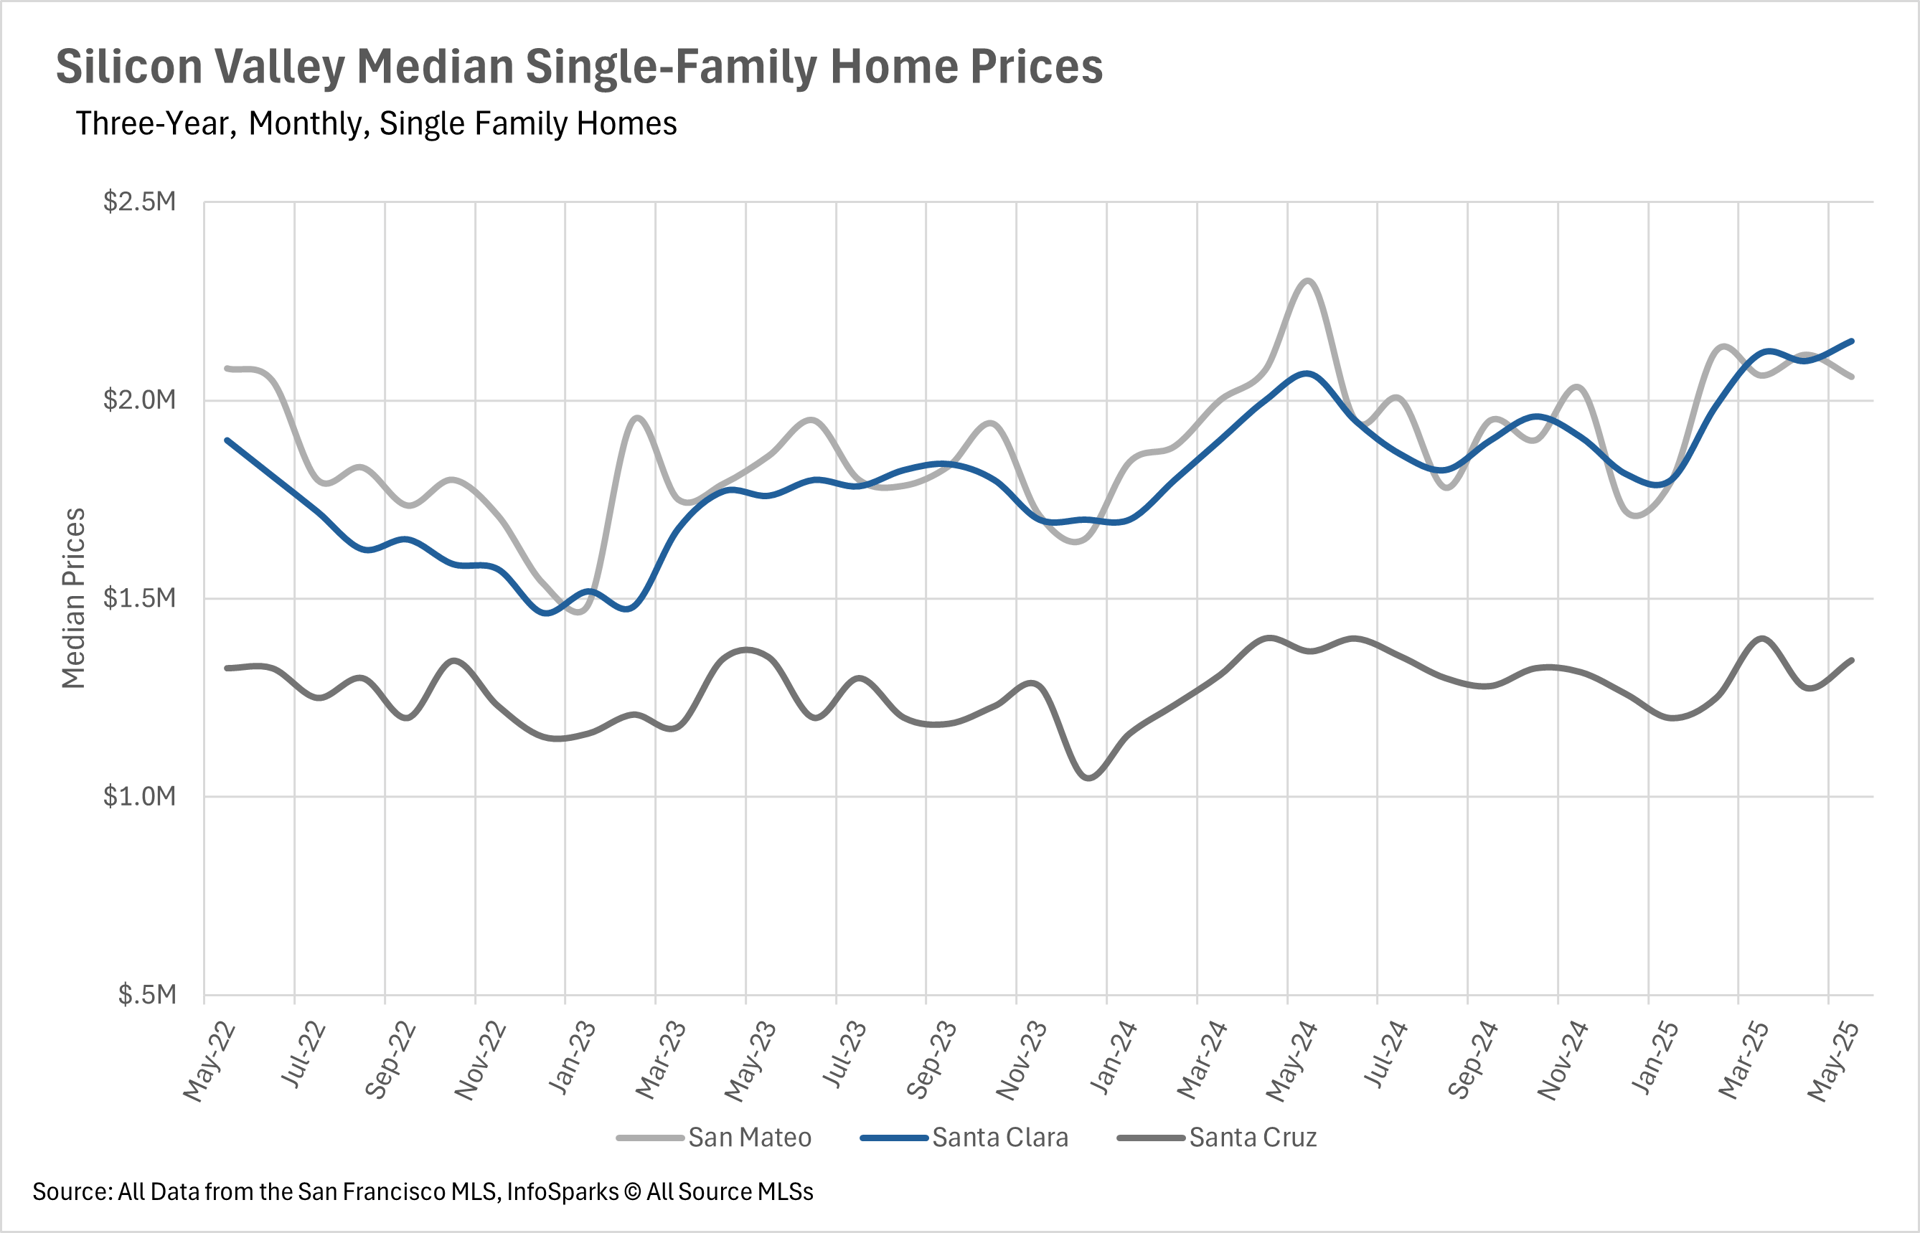
SAN FRANCISCO LEADS PRICE GROWTH WHILE OTHER REGIONS COOL

  • In May 2025, Bay Area real estate prices diverged significantly. San Francisco's single-family homes and condos saw strong price increases (7.58% and 8.26% respectively), reaching two-year highs.
  • In contrast, Silicon Valley experienced a decline in single-family home prices in Santa Cruz (-1.65%) and San Mateo (-10.46%), with Santa Clara showing only a modest gain (3.99%). The Silicon Valley condo market saw even steeper drops.
  • The North Bay mostly showed price weakness, with a significant 12.03% drop in Napa County, and smaller decreases in Solano and Sonoma. Marin County was an outlier with a 2.72% increase.
  • The East Bay was relatively stable for single-family homes (slight decrease in Contra Costa and Alameda), but condos in Alameda County faced substantial pressure with a 16.43% decline.
 INVENTORY TRENDS CREATE A TALE OF TWO MARKETS 
  • East Bay and Silicon Valley saw significant inventory increases in May, with both single-family homes and condos reaching new two-year highs (e.g., East Bay single-family inventory up 31.42%, Silicon Valley condos up 34.80%). This buildup was primarily due to fewer sales, not an increase in new listings.
  • In stark contrast, San Francisco and the North Bay experienced sharp inventory declines. San Francisco's single-family homes were down 2.54% and condos down 14.01% year-over-year. The North Bay also saw substantial drops in single-family home listings (-10.74%) and new listings across the board (around 30% decrease).
  • This created a bifurcated Bay Area market, characterized by an abundance of inventory in some regions and severe shortages in others.
 DAYS ON MARKET REVEAL REGIONAL BUYER BEHAVIOR PATTERNS
  • San Francisco remains the fastest market:
    • Single-family homes: 13 days (unchanged).
    • Condos: 23 days (improved from 31 days).
  • East Bay also shows quick movement:
    • Single-family homes: 14 days on market (despite inventory increases), but a 40% increase from last year.
  • Silicon Valley single-family homes are consistent with long-term averages, but condos face significant delays:
    • Condos: Increased days on market in Santa Clara (+46.15%), Santa Cruz (+111.11%), and San Mateo (+146.15%).
  • North Bay shows consistently longer market times for single-family homes:
    • Sonoma County: +5 days.
    • Marin, Solano, and Napa Counties: +2 days.
 MARKET DYNAMICS INCREASINGLY FAVOR

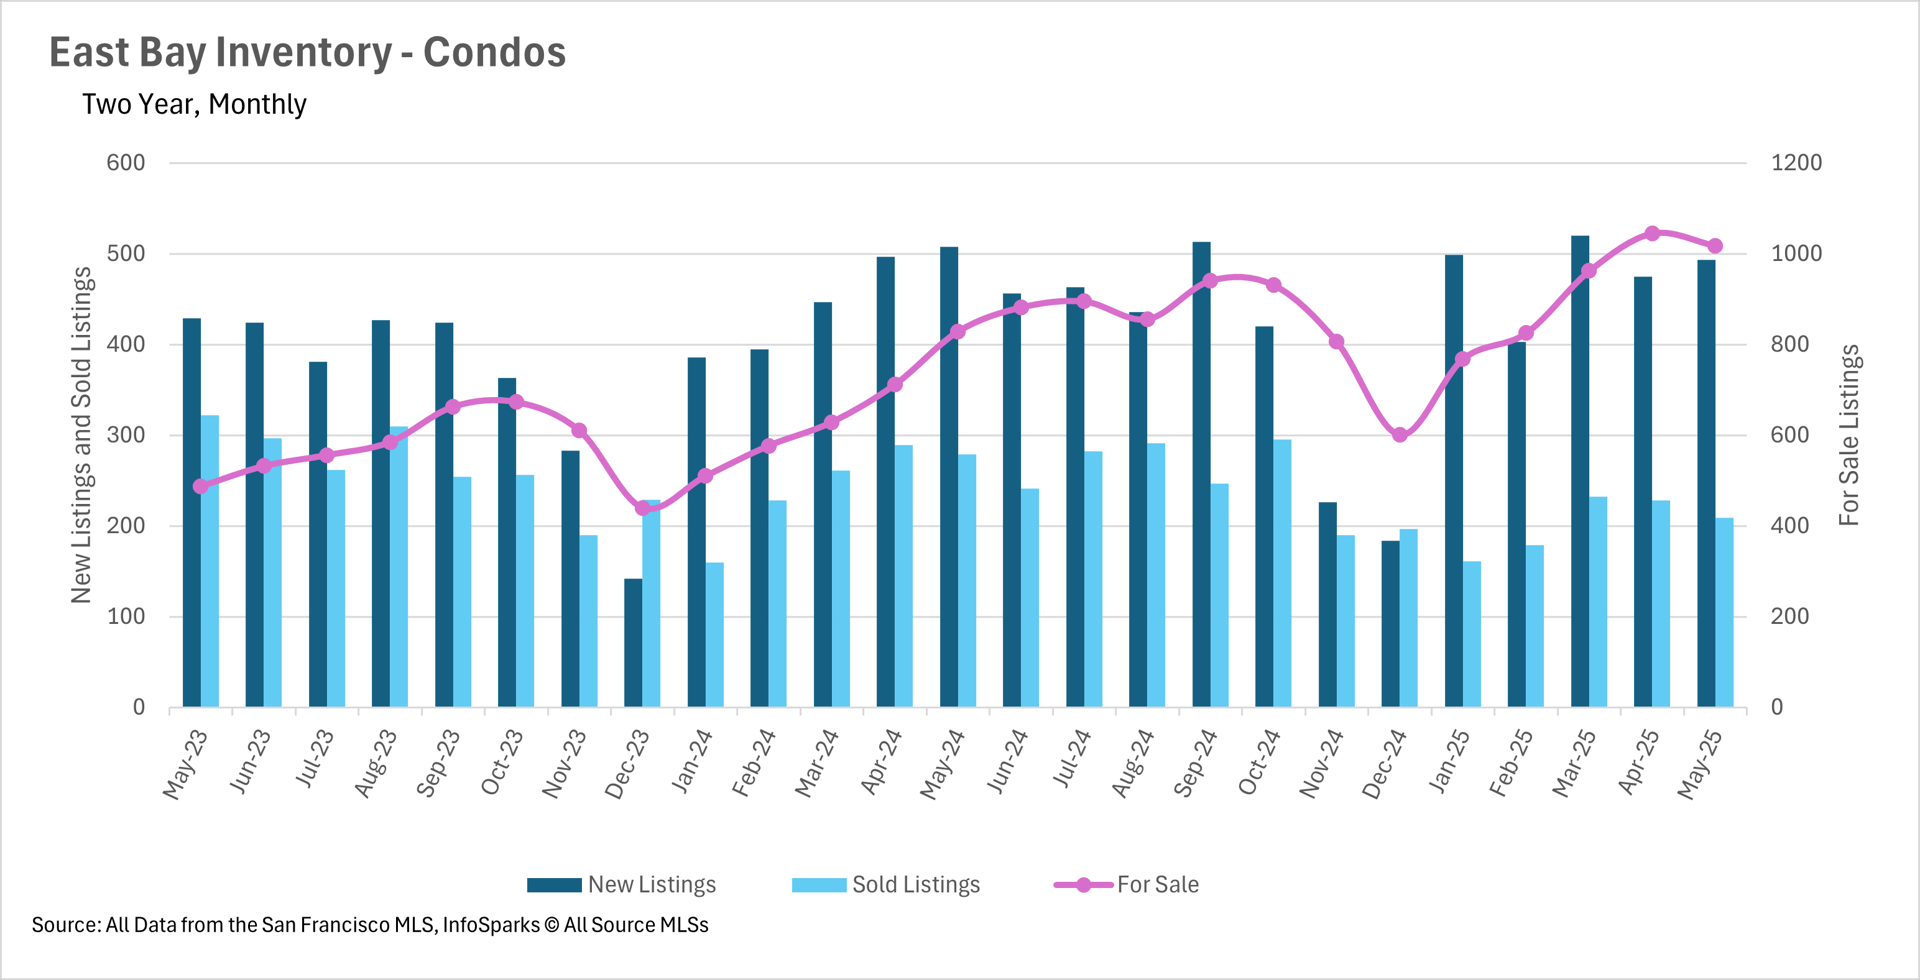
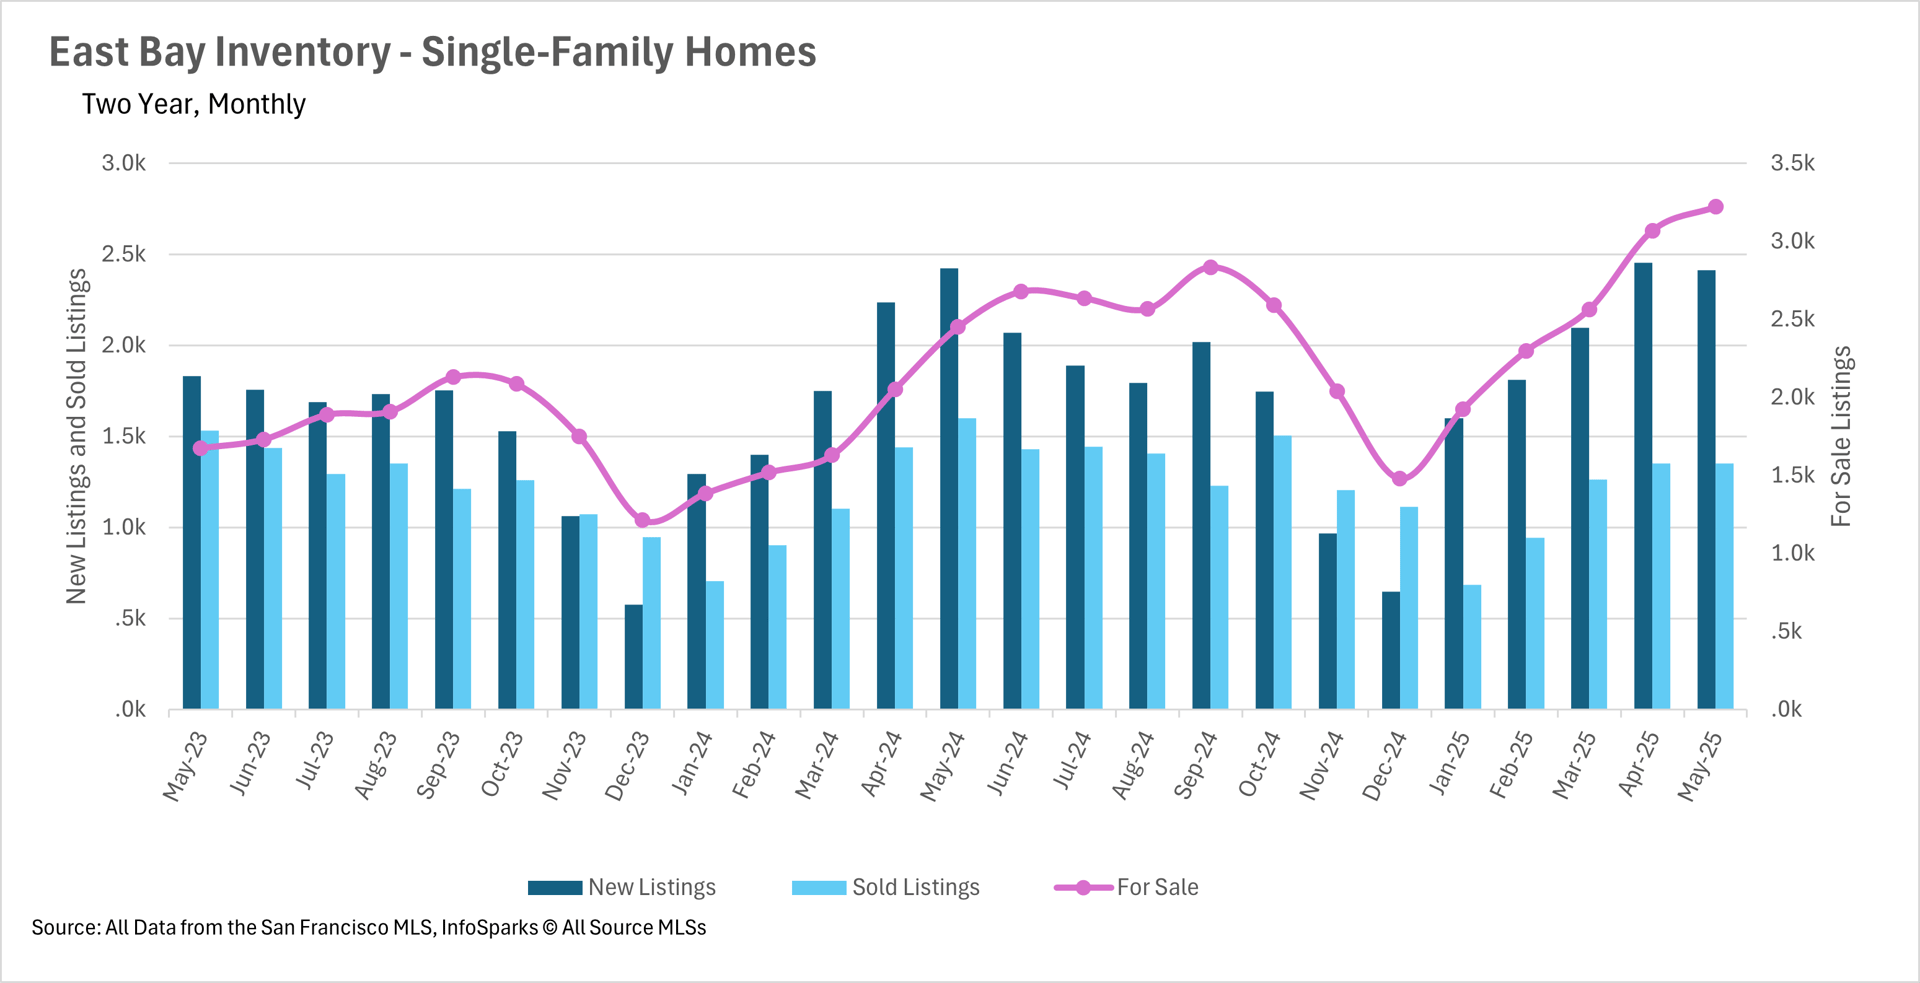
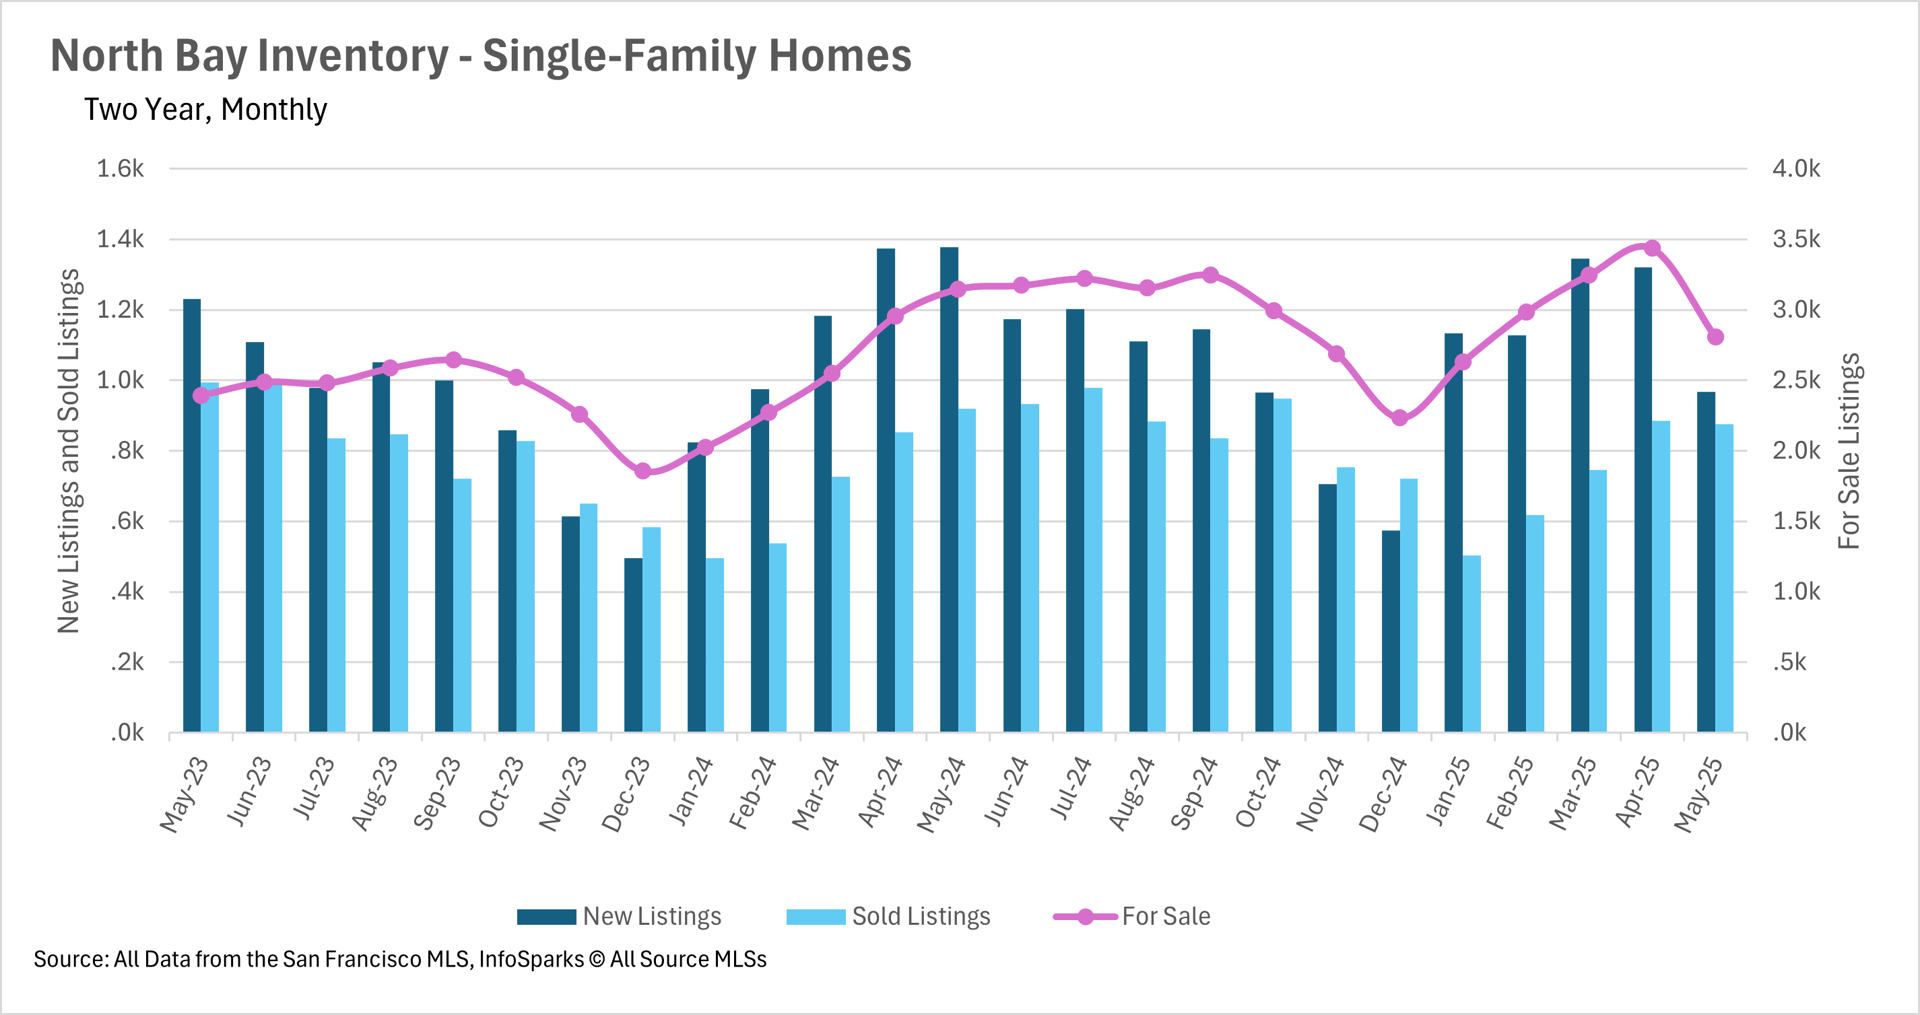
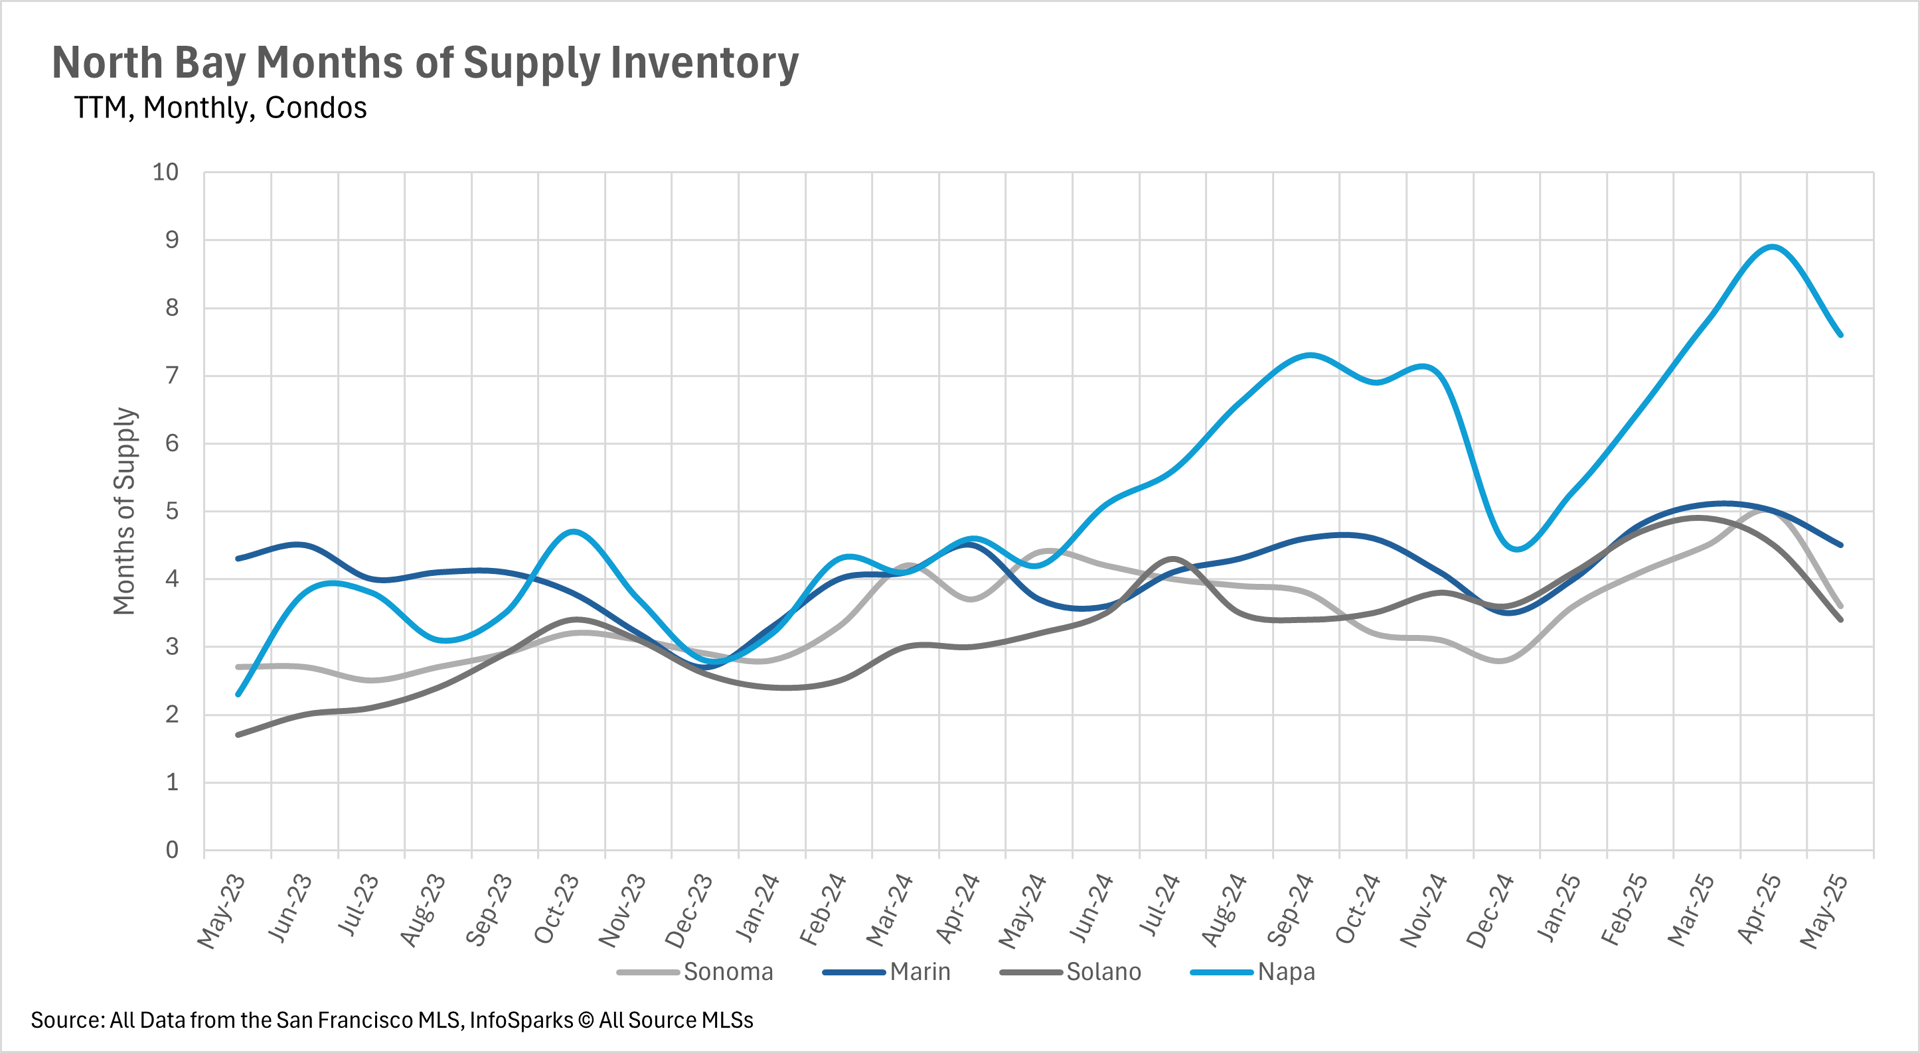
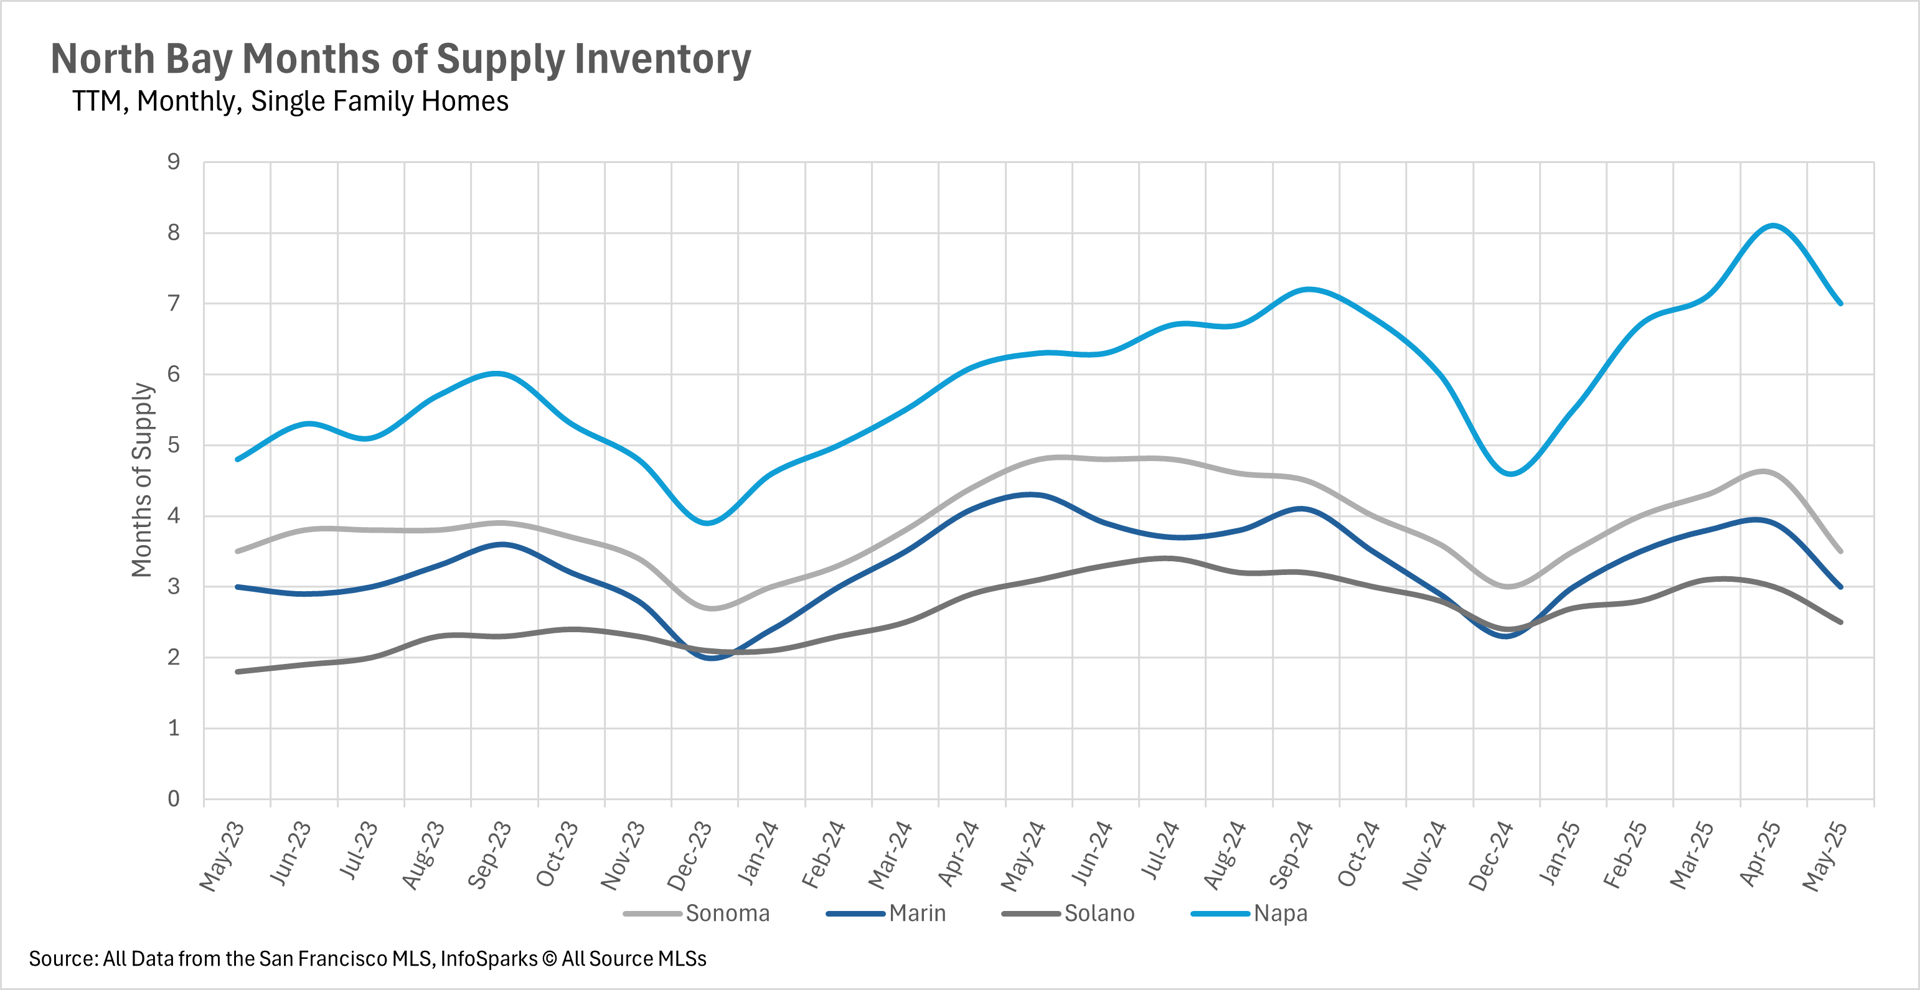
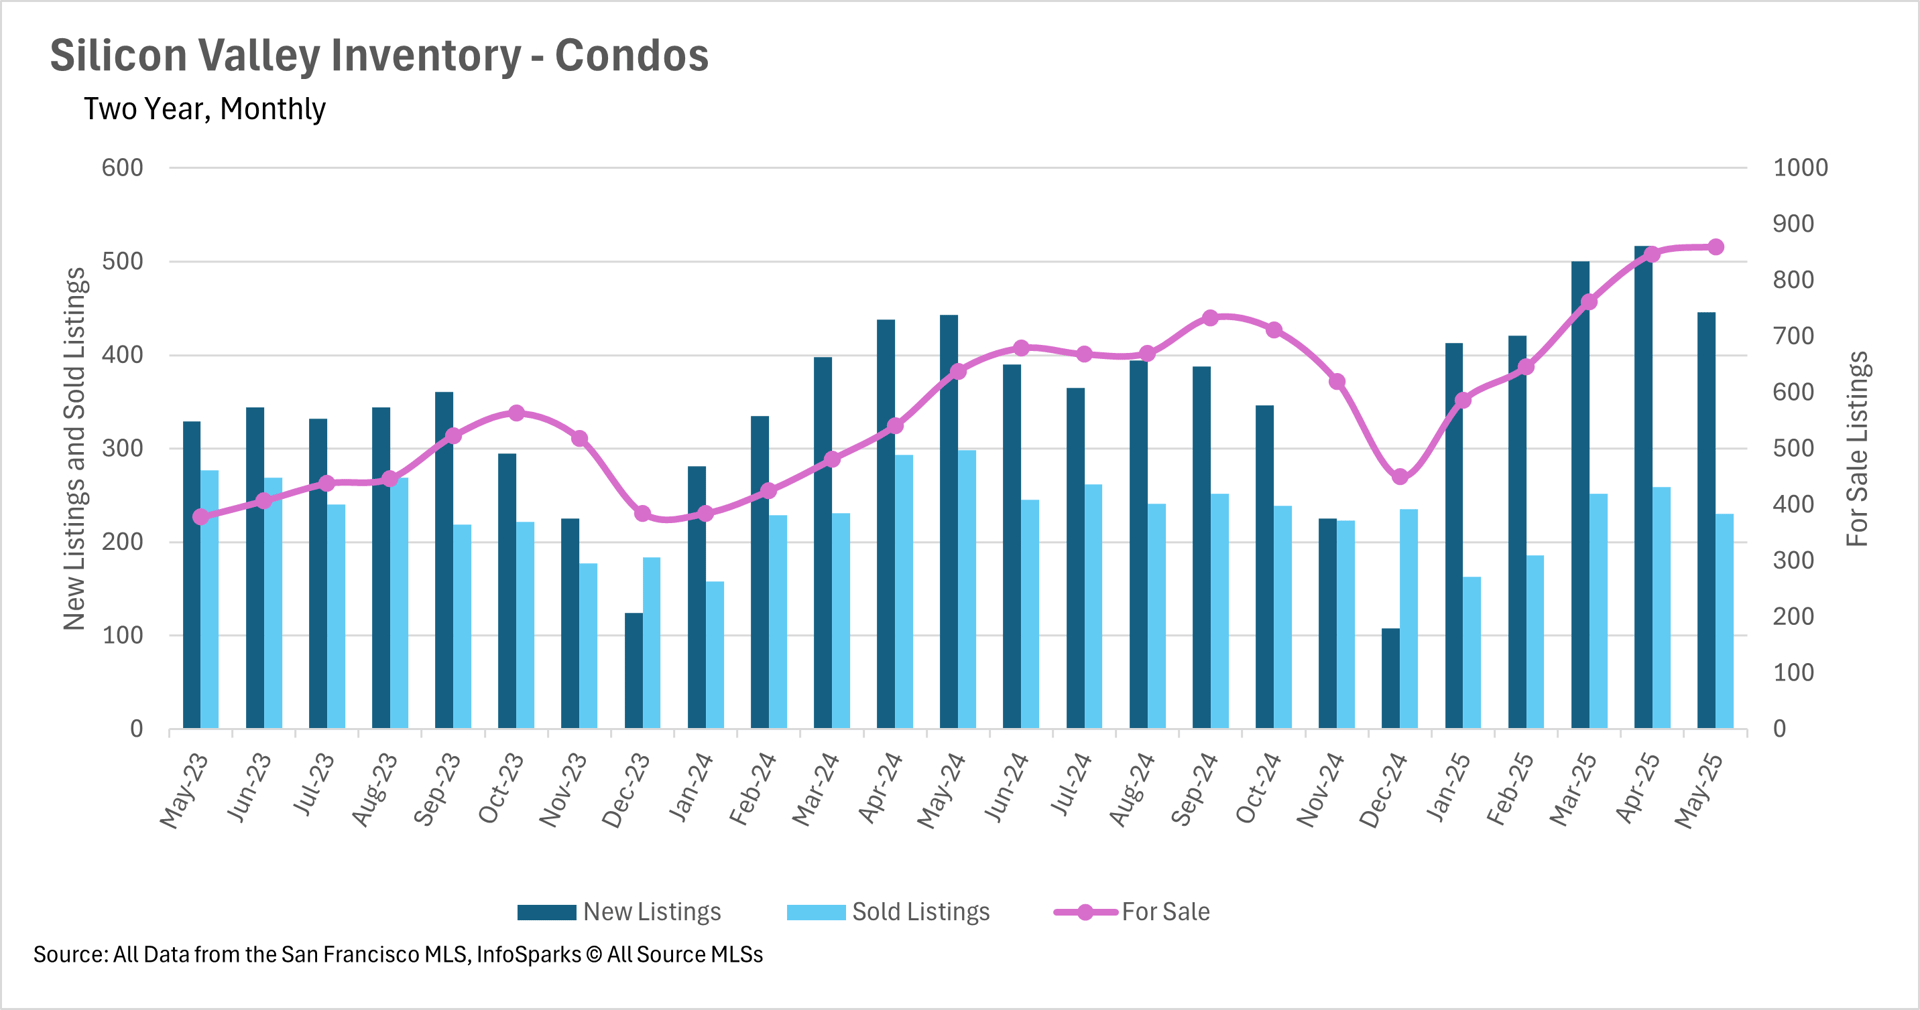
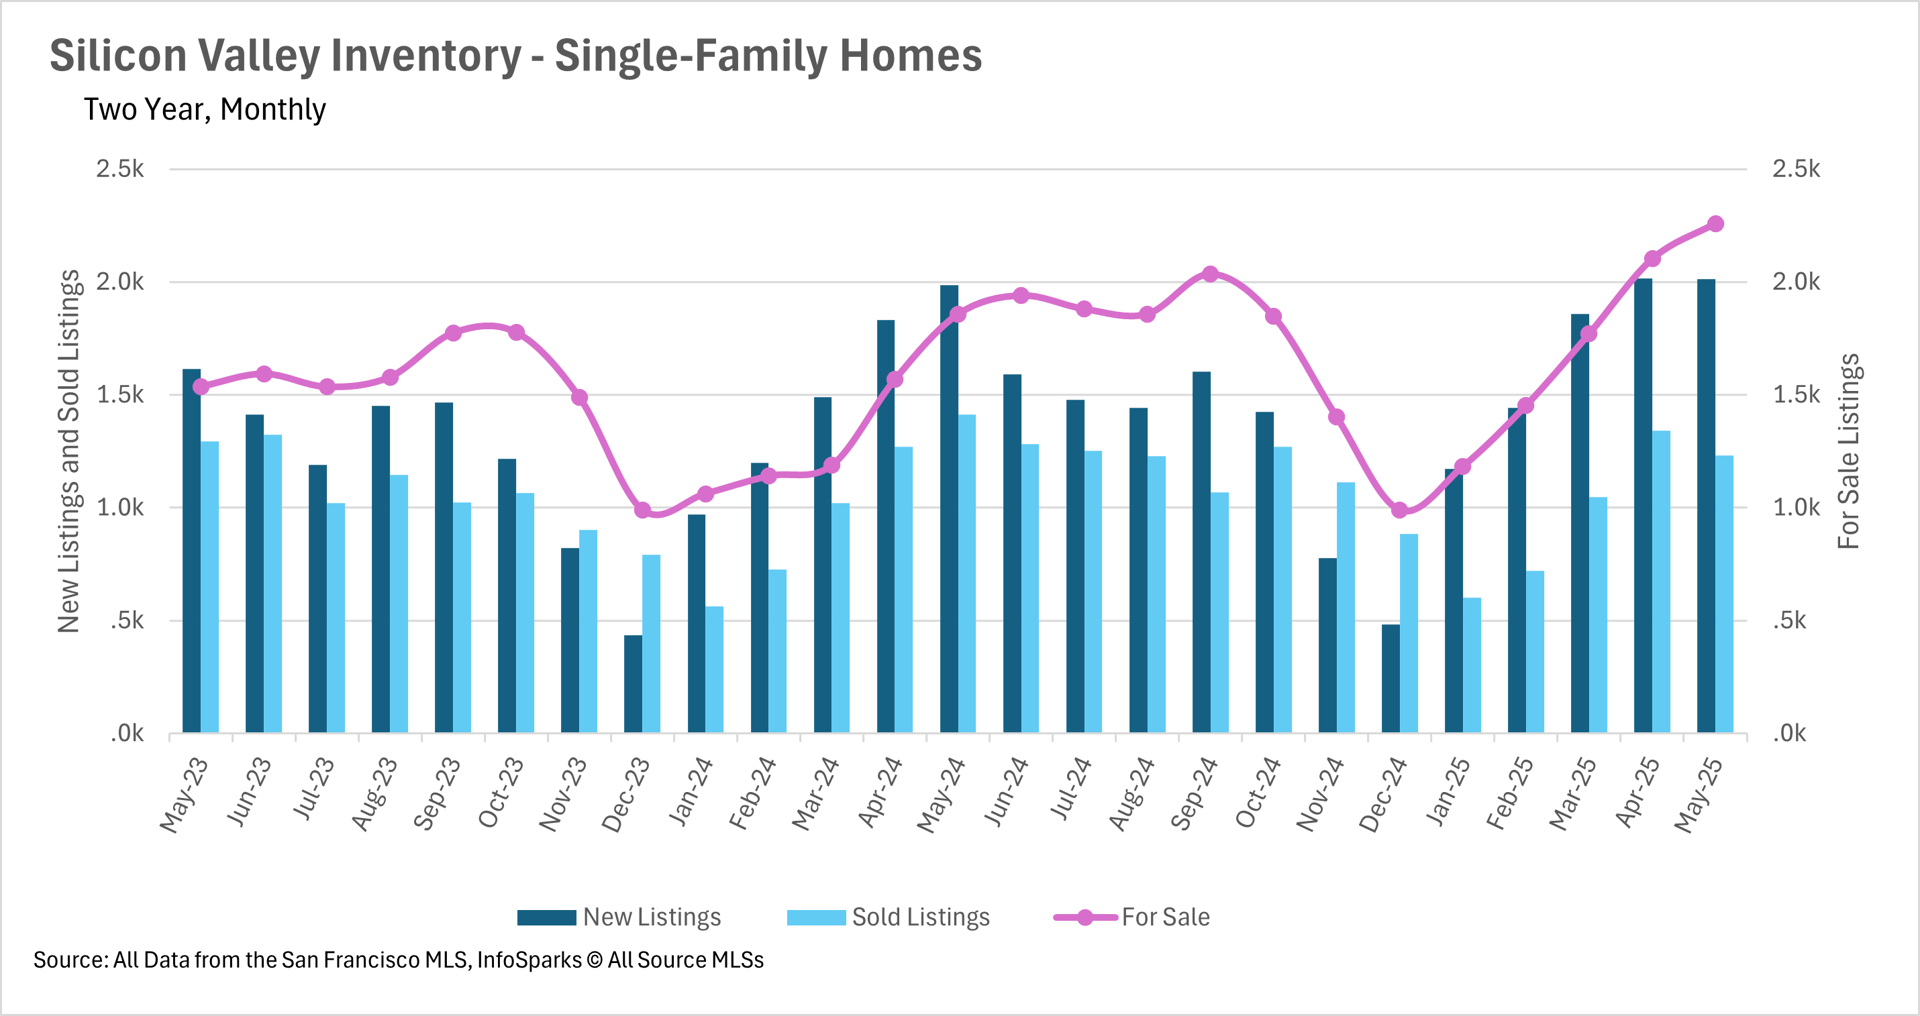
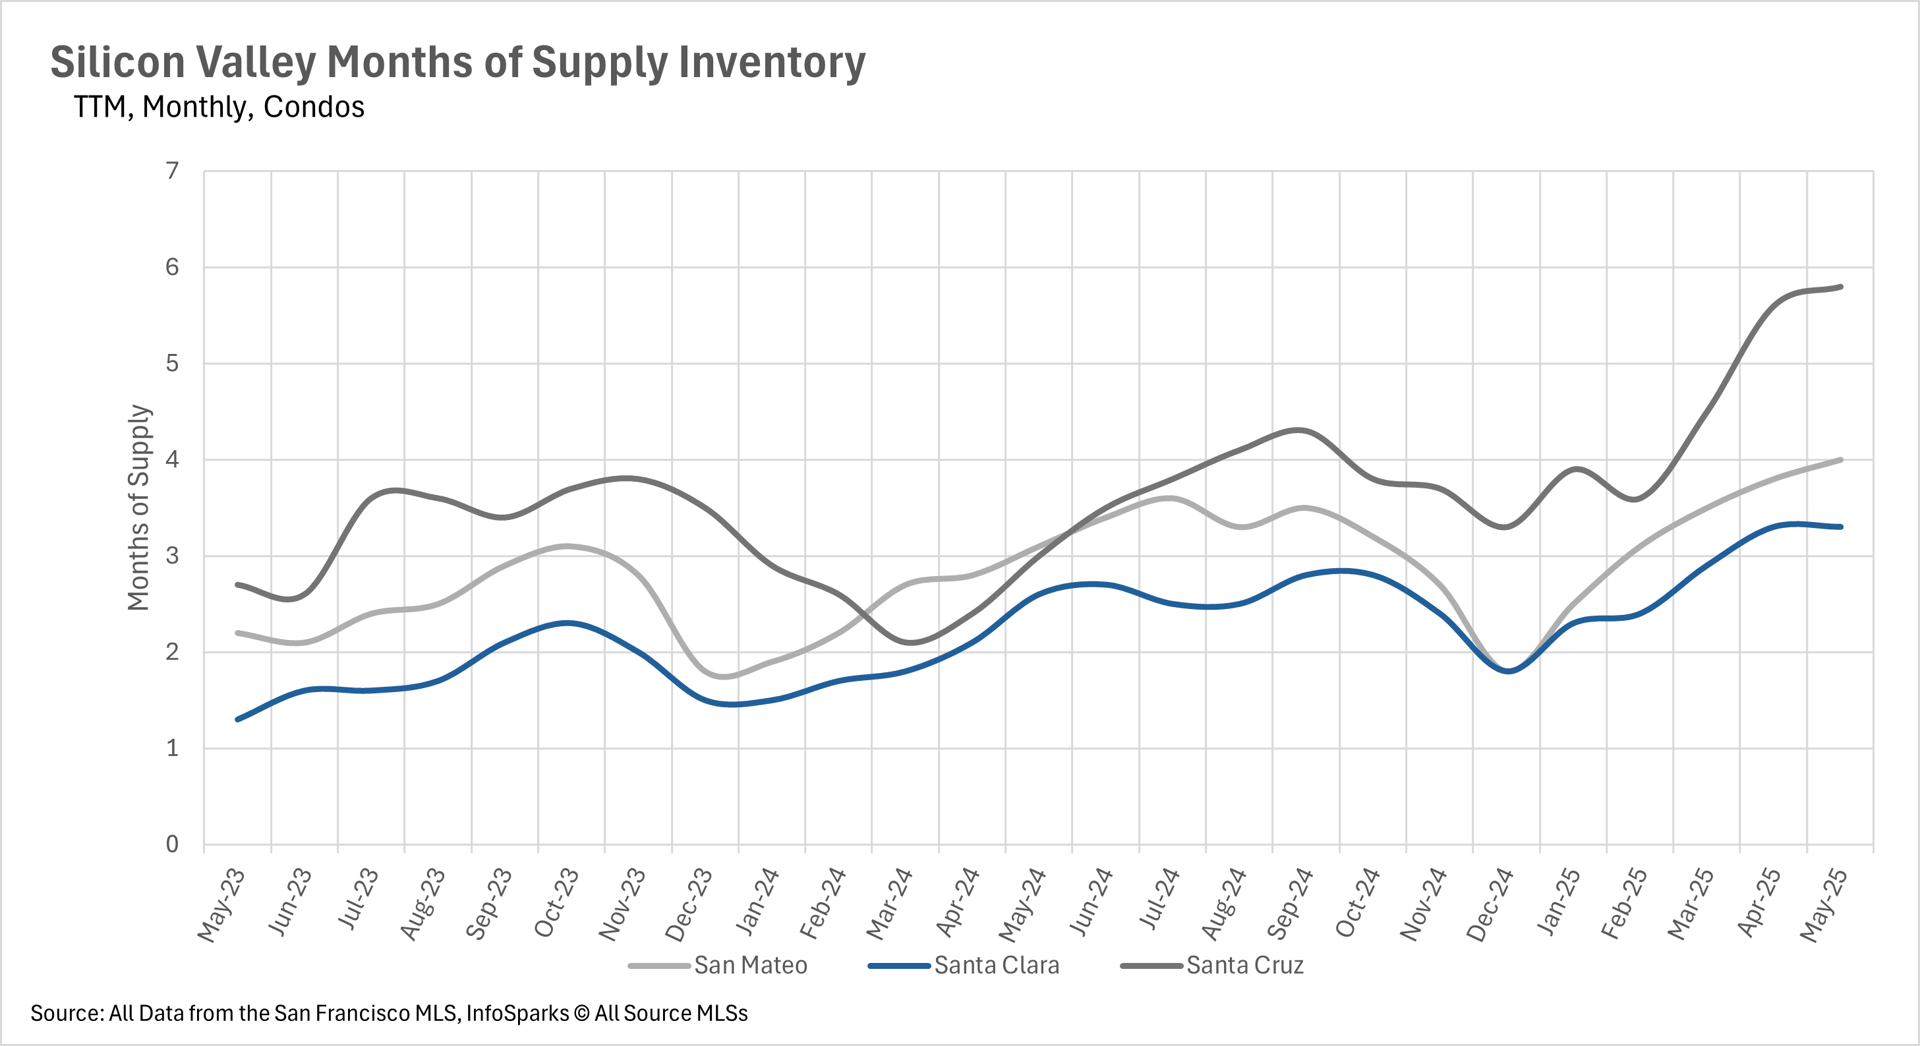
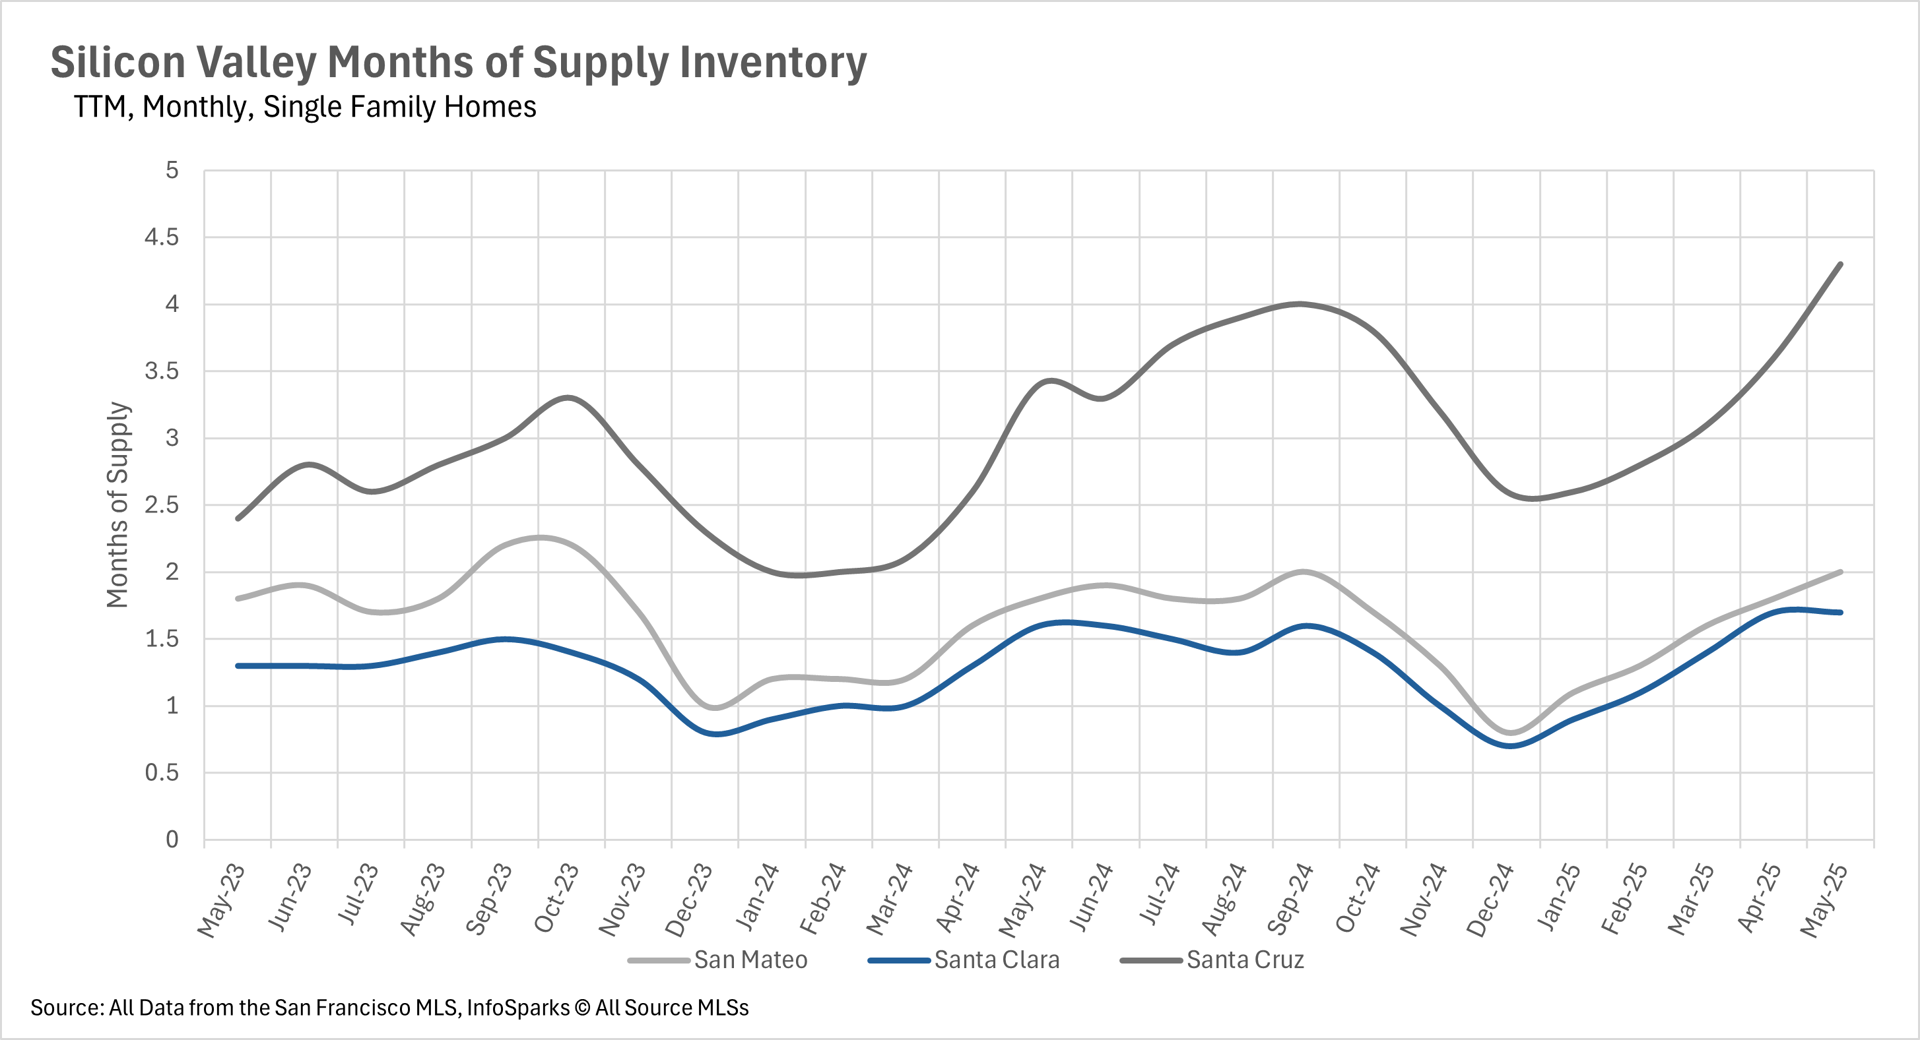
The Months of Supply Inventory (MSI) reveals a consistent Bay Area trend: single-family homes largely remain in a seller's market, while condos increasingly favor buyers.

  • San Francisco exemplifies this: Single-family homes are a strong seller's market (1.8 MSI), while condos lean towards buyers (3.8 MSI).
  • Silicon Valley has largely become a buyer's market for condos (4-5.8 MSI across counties). For single-family homes, Santa Cruz is now a buyer's market (4.3 MSI), while San Mateo (2 MSI) and Santa Clara (1.7 MSI) remain seller's markets.
  • East Bay is similarly divided: Single-family homes in Alameda (2.3 MSI) and Contra Costa (2.8 MSI) are seller's markets, but condos in both counties favor buyers (4.8 and 3.9 MSI).
  • North Bay shows the most variation: Solano County (2.5 MSI) is a seller's market, Marin is balanced (3 MSI), and Sonoma (3.5 MSI) and Napa (7 MSI) are firmly buyer's markets.
LOCAL LOWDOWN DATA
EAST BAY
 
 
NORTH BAY
 
 
SILICON VALLEY


Let's Talk

You’ve got questions and we can’t wait to answer them.

Set Up Your Search for New Homes

Check It Out