What’s Really Happening in the Bay Area Housing Market This September
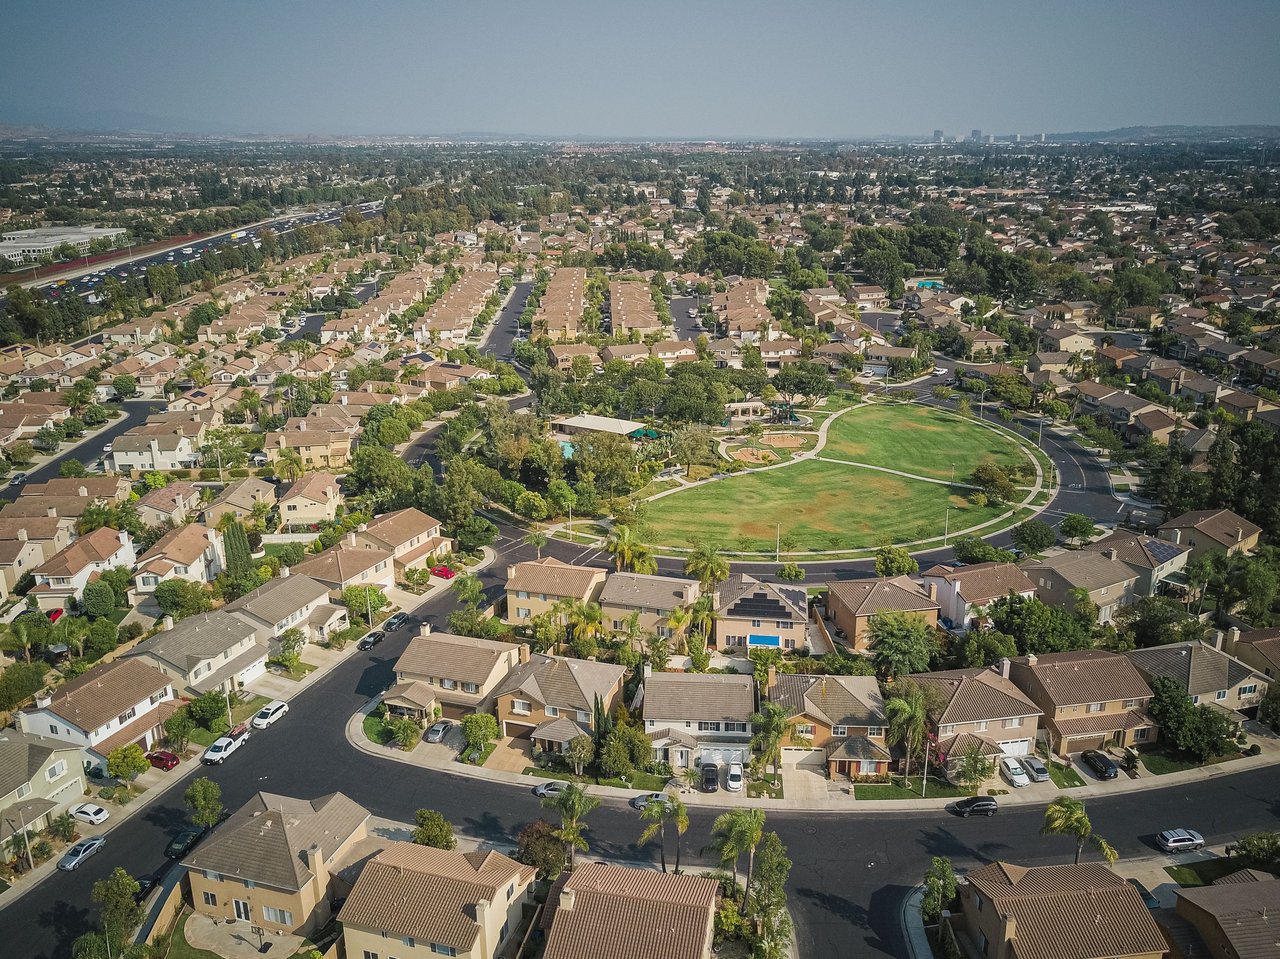
The national housing market took a breather in July, but here in Silicon Valley, the story depends on where and what you are buying or selling. Nationally, prices eased after five straight months of gains, mortgage rates moved higher again, and fewer homes came to market. Locally, inventory tightened even more—but conditions varied widely among counties and between single-family homes and condos.
The takeaway? This is not one market moving in one direction. It is several markets moving at once.
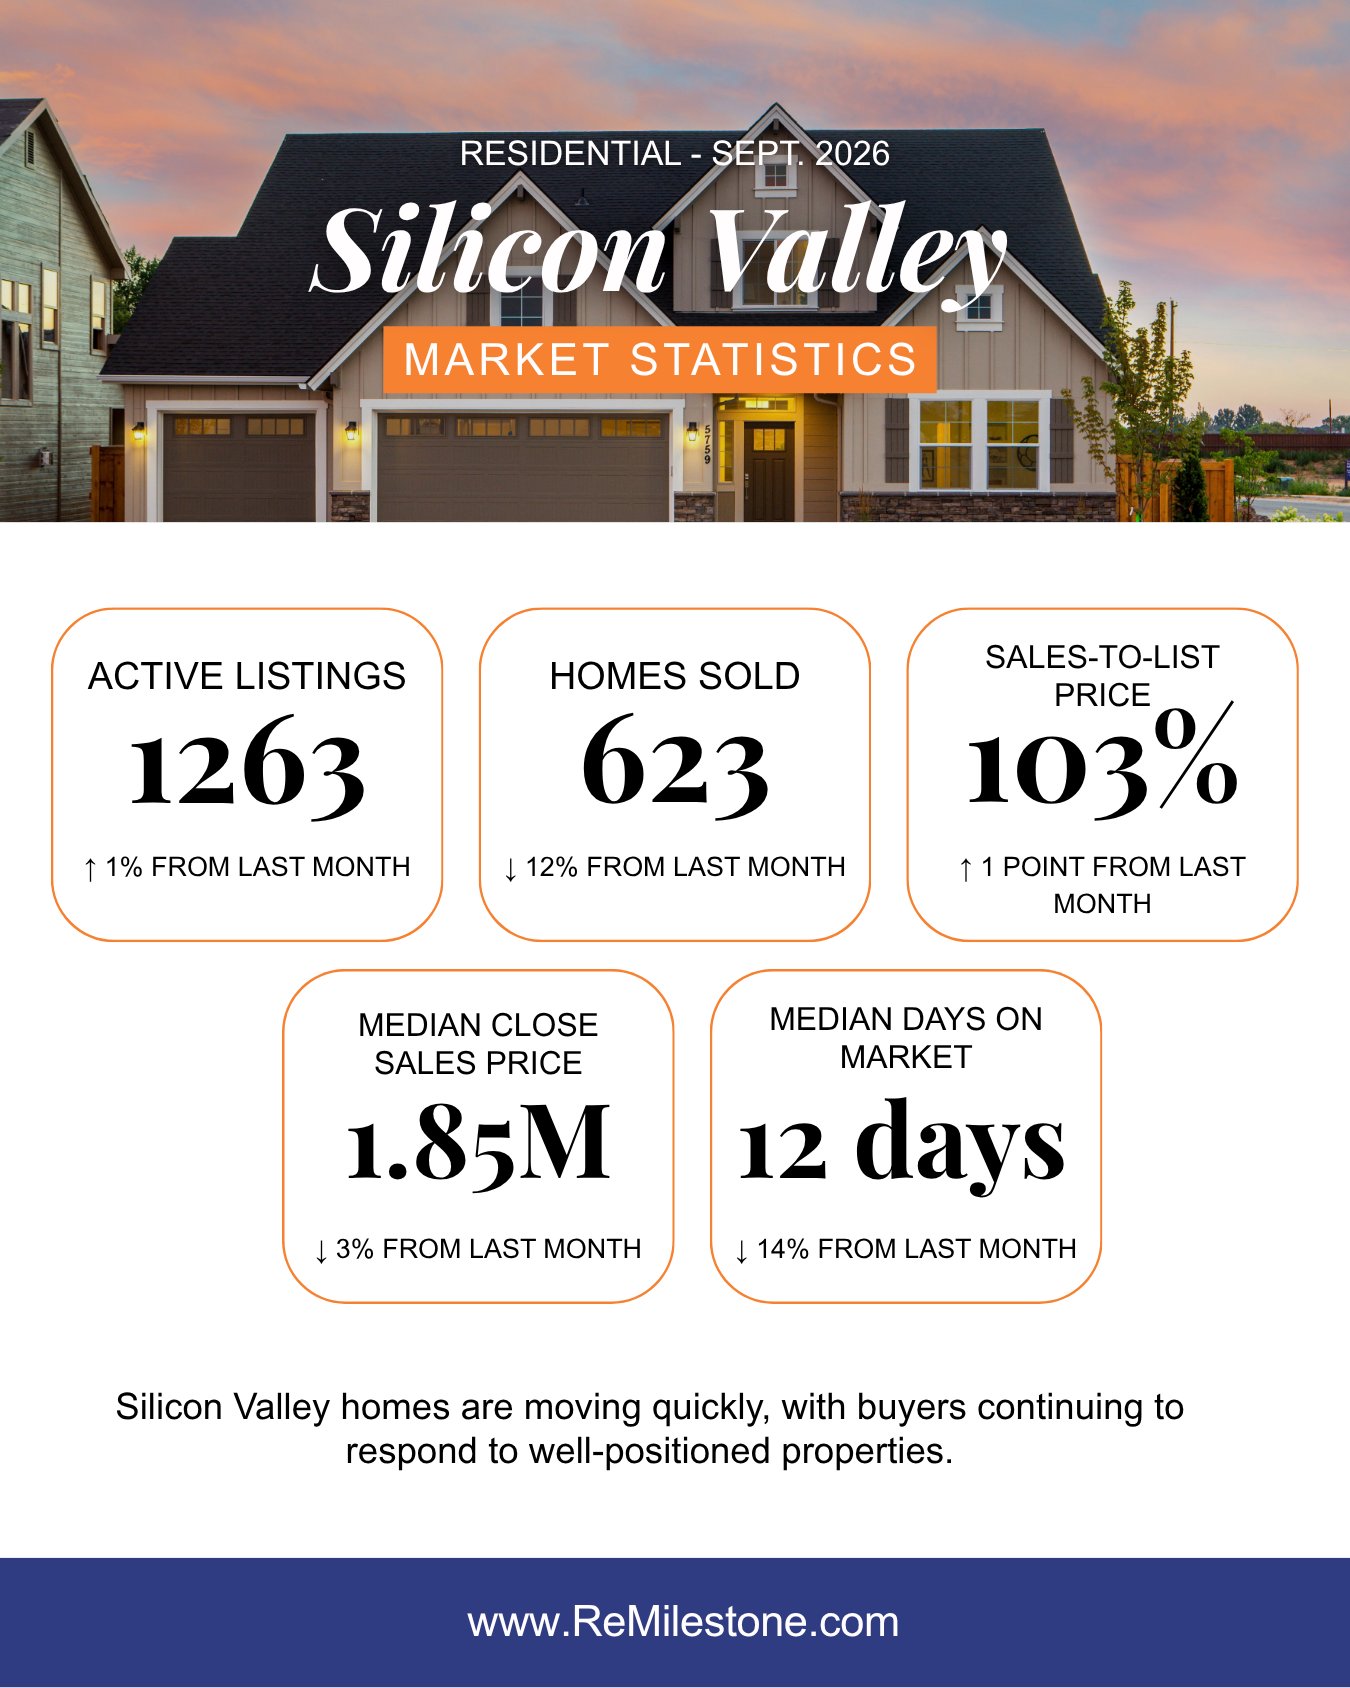
The latest Silicon Valley numbers show a market that remains active but selective:
Sales slowed from the previous month, but well-positioned homes continued to move quickly and often sold above asking.
The numbers tell part of the story. In this month’s market update, Linda explains why Silicon Valley feels so mixed—and why your neighborhood, price point, and competition matter more than the headline.
[Watch Linda’s Silicon Valley Market Update →]
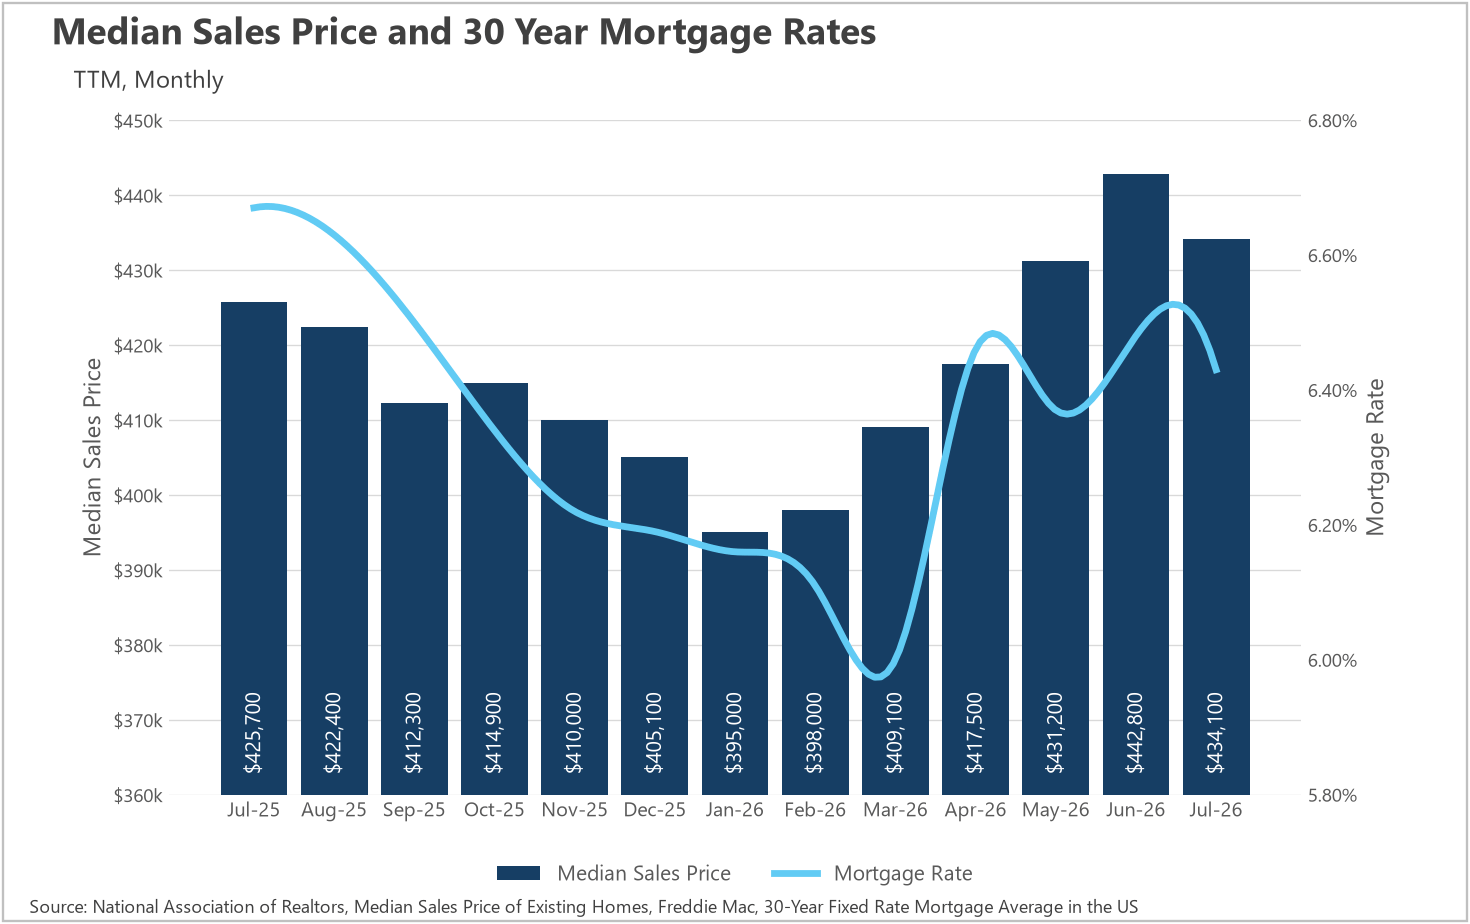
After climbing steadily through the spring, the national median sale price declined modestly in July.
A midsummer dip is not unusual. The bigger issue for buyers remains the relationship between home prices, mortgage rates, and monthly payments.
The average 30-year mortgage rate eased to 6.43% in July before rising to 6.69% in August. July’s estimated monthly principal-and-interest payment was $2,254—almost identical to the payment one year earlier.
For buyers, the most important number is not simply the price or the rate. It is how the two work together to shape the monthly payment.
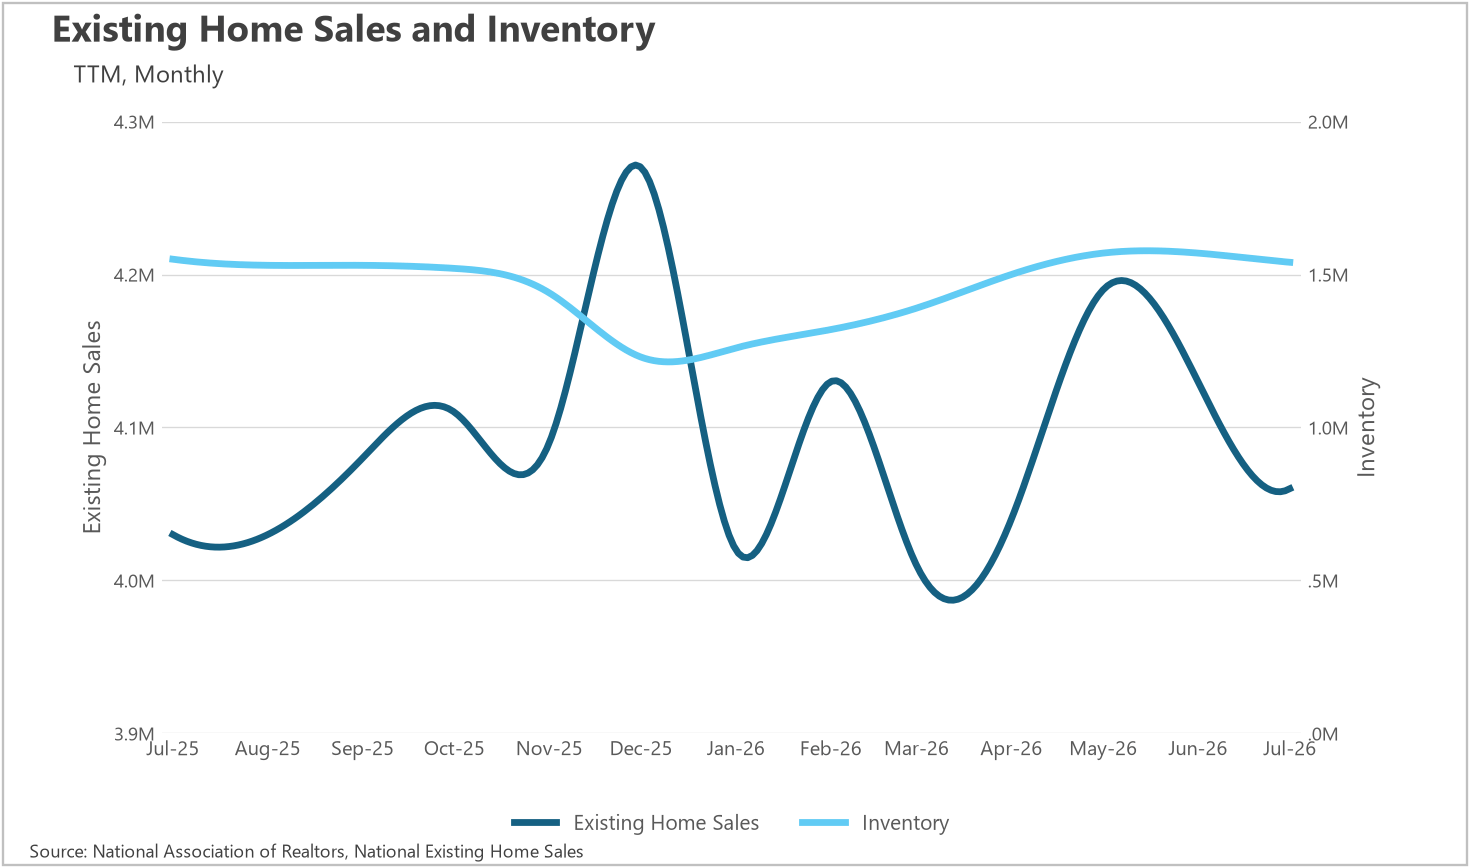
National housing supply also moved lower in July:
Some of that decline is seasonal, since listing activity typically peaks during the spring. Still, fewer new listings combined with relatively steady sales means the pool of available homes may continue to thin.
Nationally, buyers generally have more selection than they do in Silicon Valley. But the market is not moving decisively toward either buyers or sellers. Supply is tightening while affordability continues to limit demand.
Silicon Valley’s July numbers show why national headlines only tell part of the story.
San Mateo County continued to command a Peninsula premium. Santa Clara County showed signs of leveling after reaching $2.05 million in May, while Santa Cruz County remained more variable from month to month.
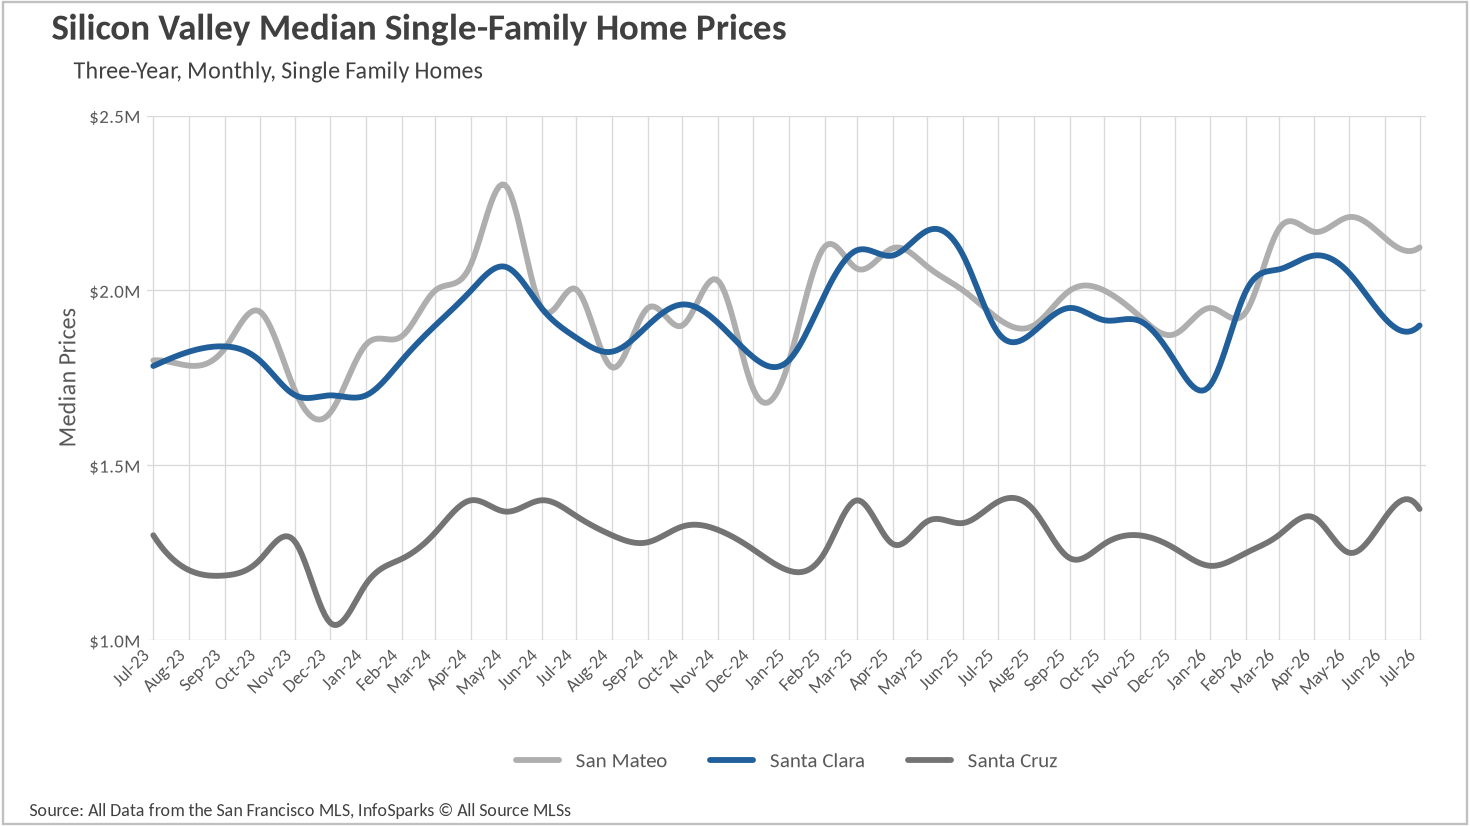
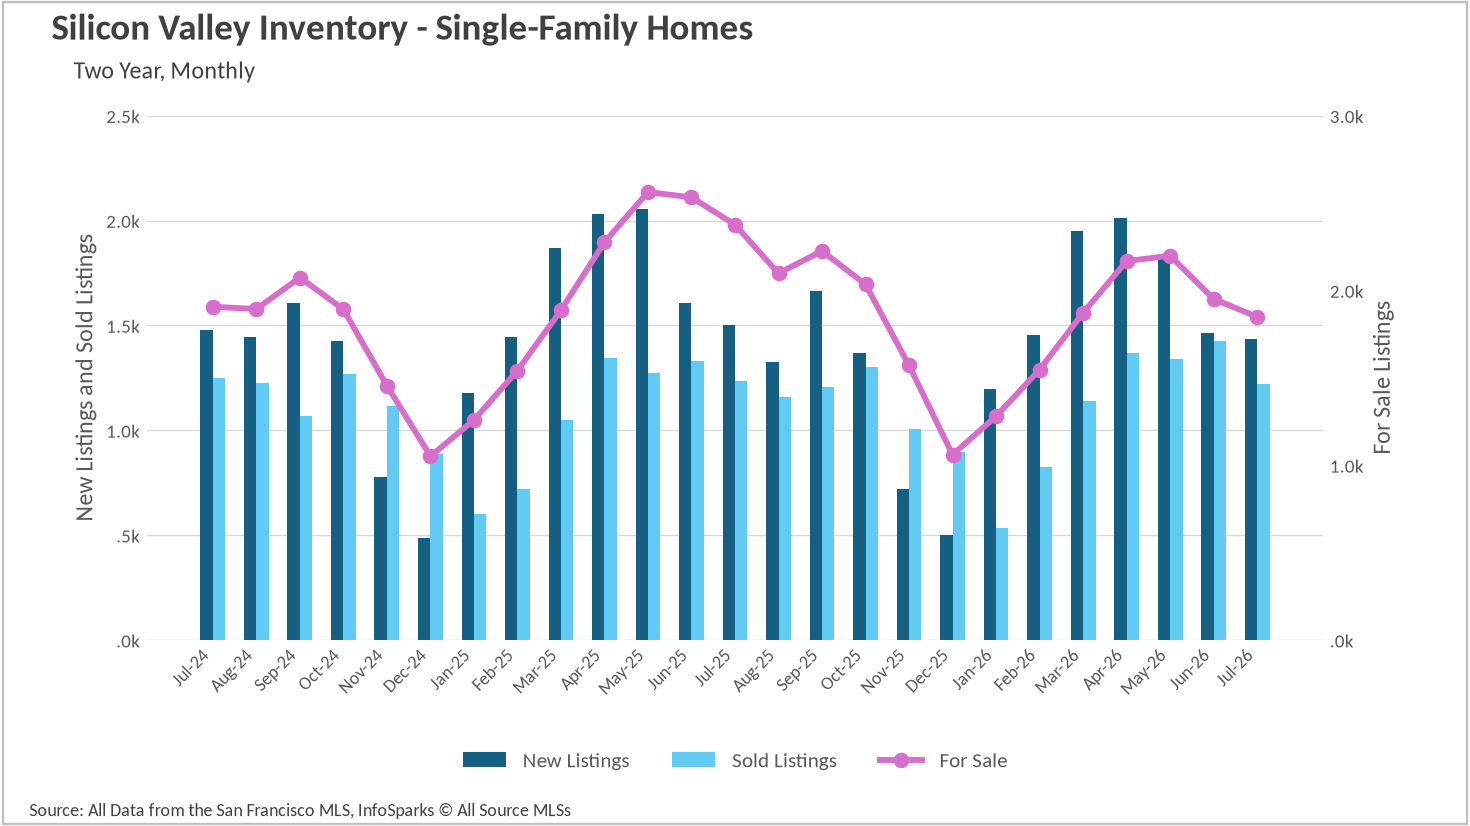
Across San Mateo, Santa Clara, and Santa Cruz Counties, only 1,849 single-family homes were available in July.
Buyers are still purchasing homes, but sellers are bringing fewer properties to market. That imbalance continues to support desirable, well-prepared single-family homes—even as buyers become more selective.
Low inventory helps sellers, but it does not guarantee that every home will sell quickly. Pricing, preparation, presentation, and location still matter.
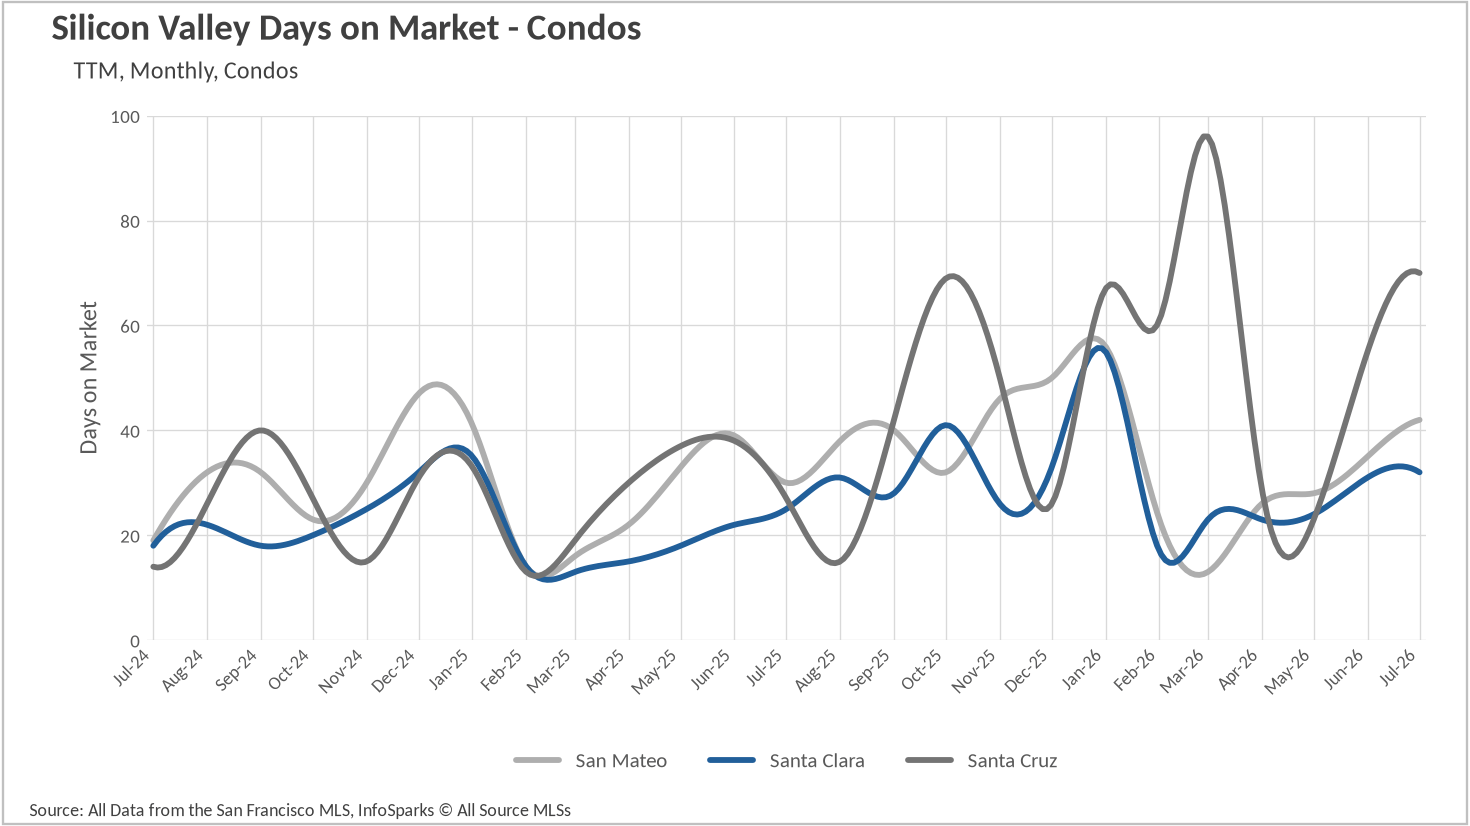
Single-family homes in San Mateo and Santa Clara Counties continued to move quickly, averaging 14 days on market in July. Santa Cruz County single-family homes averaged 25 days.
Condos generally required more patience:
This distinction matters. A strategy that works for a single-family home may not work for a condo—even within the same city.
Condo sellers may need a longer runway and sharper pricing from the beginning. Condo buyers, meanwhile, may have more time to compare properties, review disclosures, and negotiate.
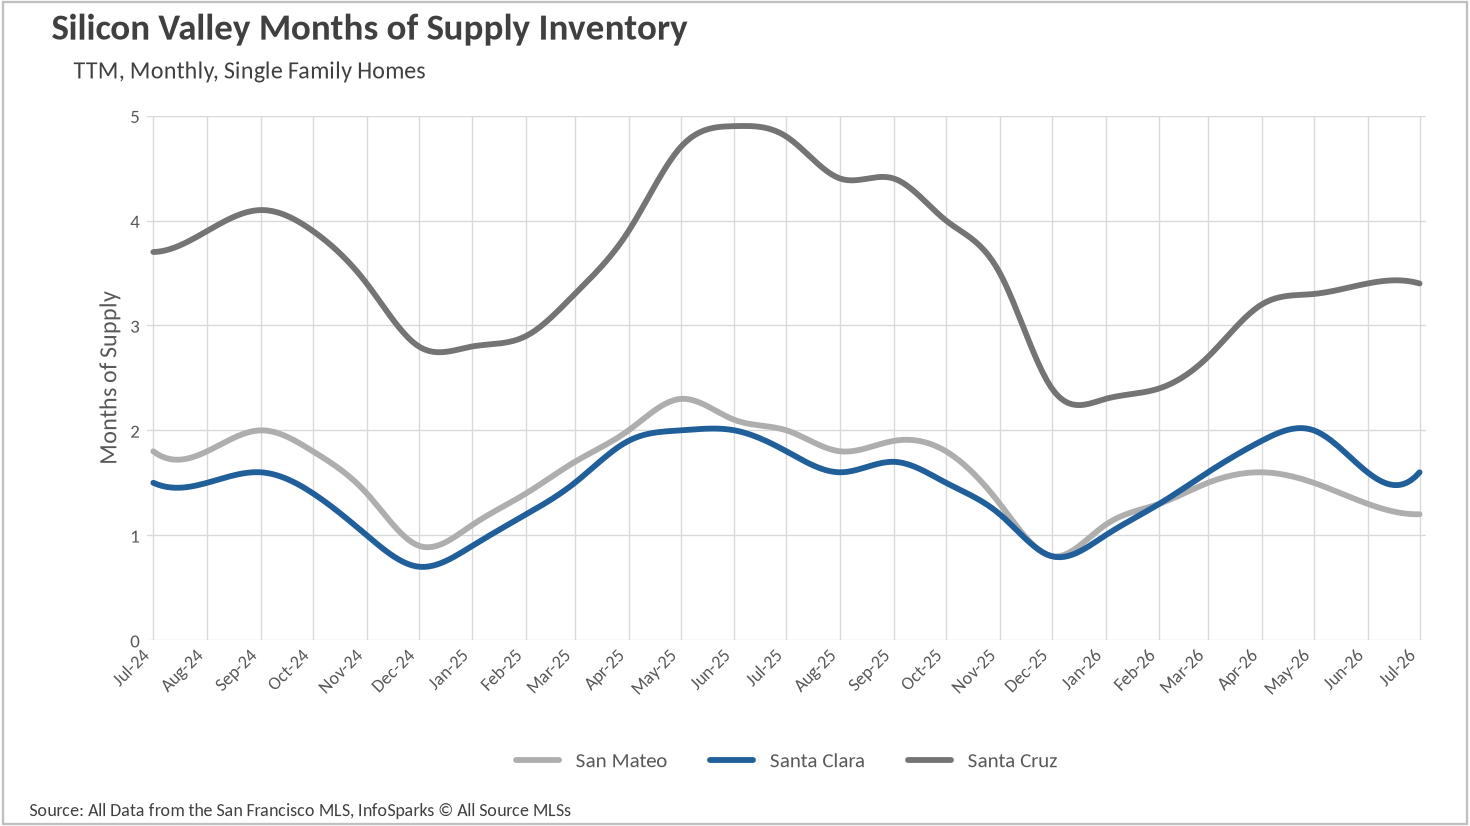
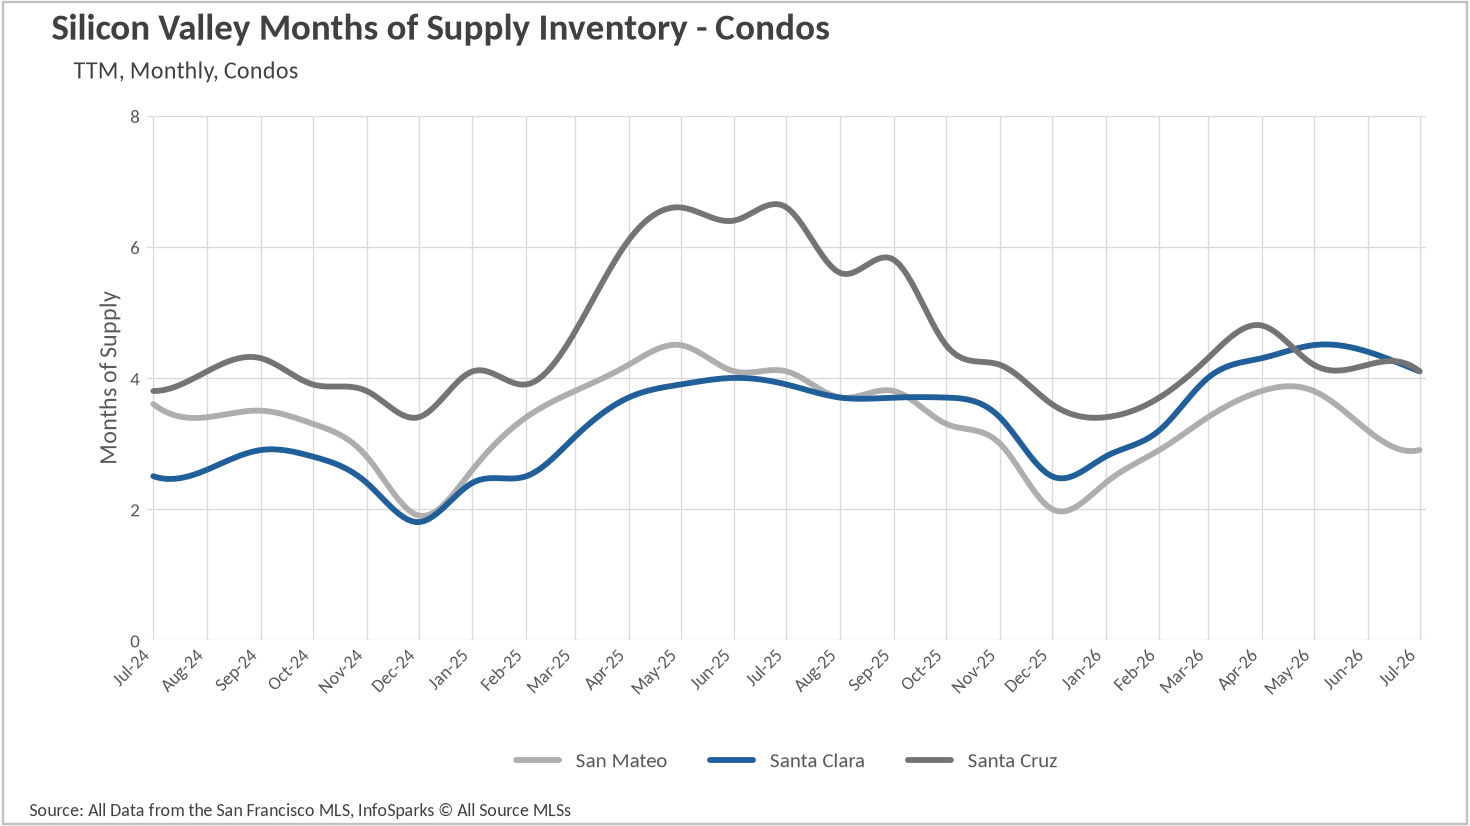
Months of supply makes the difference especially clear.
Single-family conditions remain firmly seller-favored in San Mateo and Santa Clara Counties. Santa Cruz County is closer to balance.
Condo buyers—especially in Santa Clara and Santa Cruz Counties—are more likely to find additional choices, longer decision windows, and greater negotiating room.
Market statistics reflect the reporting periods described above. Conditions may vary by city, neighborhood, price range, property type, and individual property. Sources: National Association of Realtors®, Freddie Mac, and San Francisco MLS/InfoSparks®. Data is considered reliable but is not guaranteed.
Stay up to date on the latest real estate trends.
September 22, 2026
A More Selective Market
September 17, 2026

September 15, 2026

September 10, 2026
September 3, 2026

August 27, 2026
August 26, 2026
Prices Ease, Inventory Tightens, and the Bay Area Stays Competitive

August 21, 2026

August 20, 2026
You’ve got questions and we can’t wait to answer them.