February '24 Market Update

Market Update

February '24 Market Update

FEBRUARY '24 MARKET UPDATE

Mortgage rates were remarkably stable in January, and near-term Fed rate cuts look less likely

QUICK TAKE:
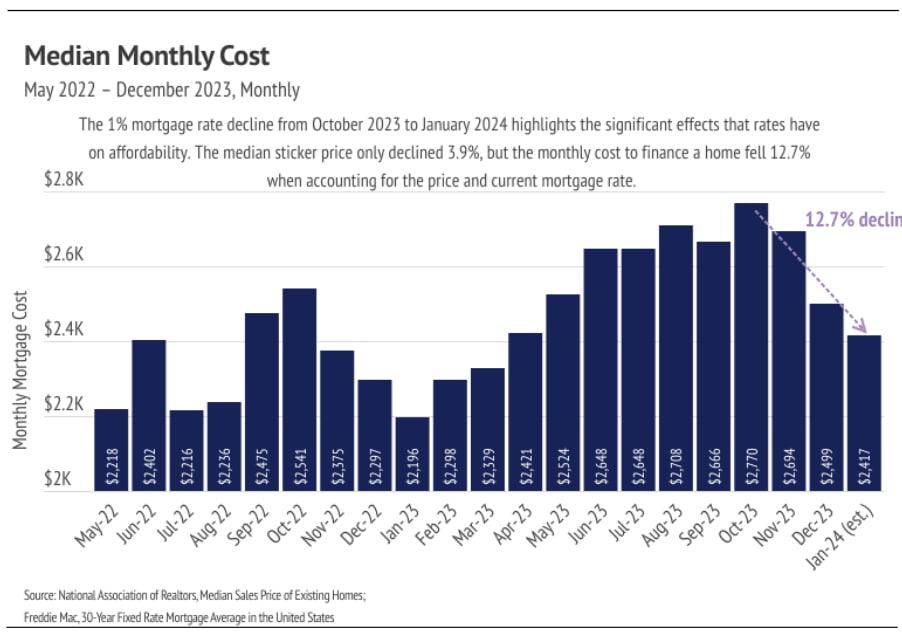
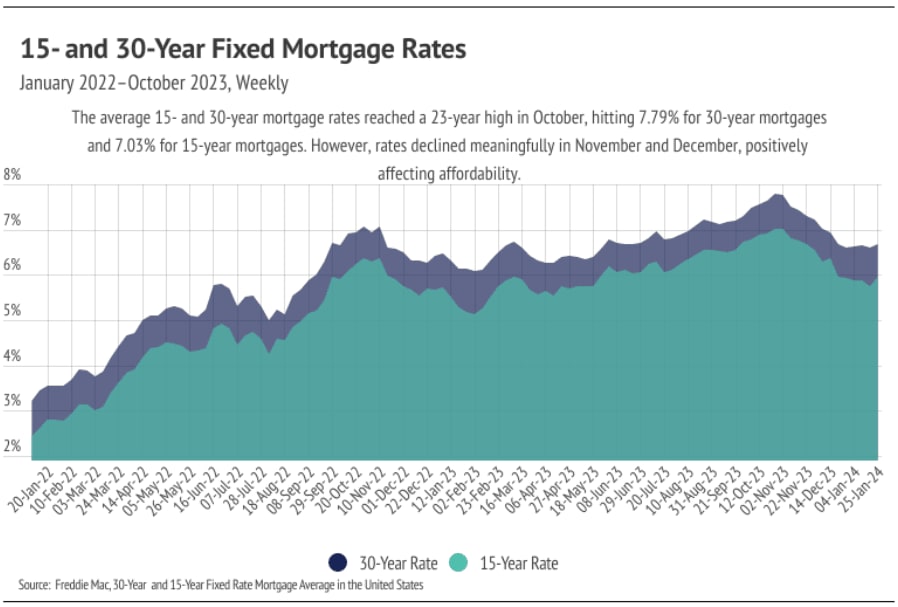
  • After the average 30-year mortgage rate fell over 1% in November and December 2023, rates stabilized between 6.60% and 6.70% in January 2024. Median prices continued to decline in January, but we expect prices to rise in February — the seasonal norm.
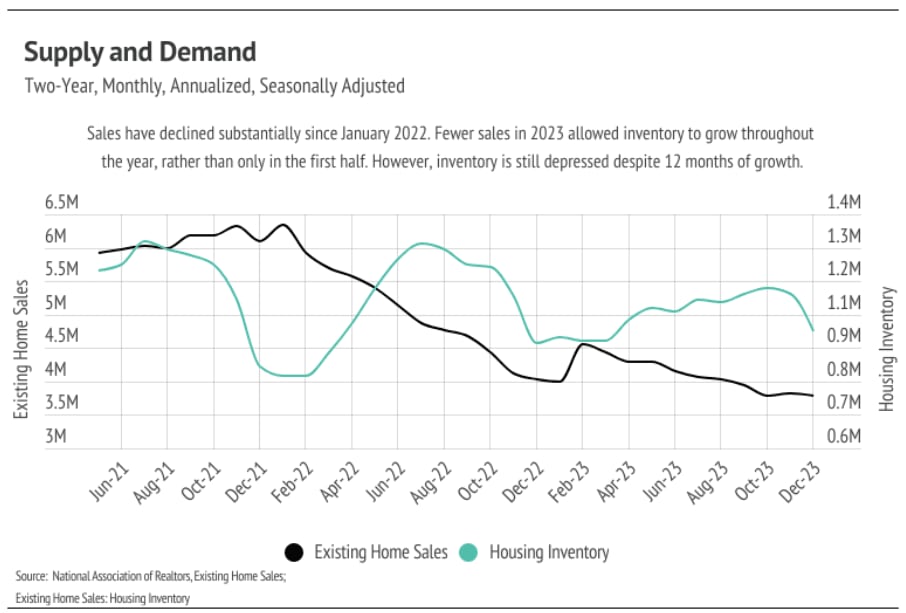
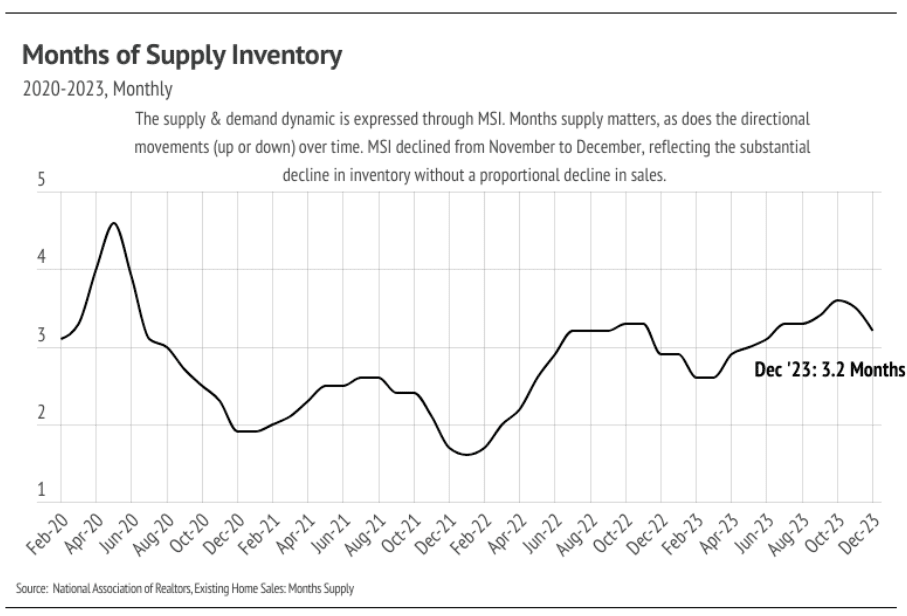
  • Sales fell 6% year over year and 1% month over month, hitting the lowest levels in modern history. Inventory fell nearly 12% month over month, making supply incredibly tight regardless of slower sales.
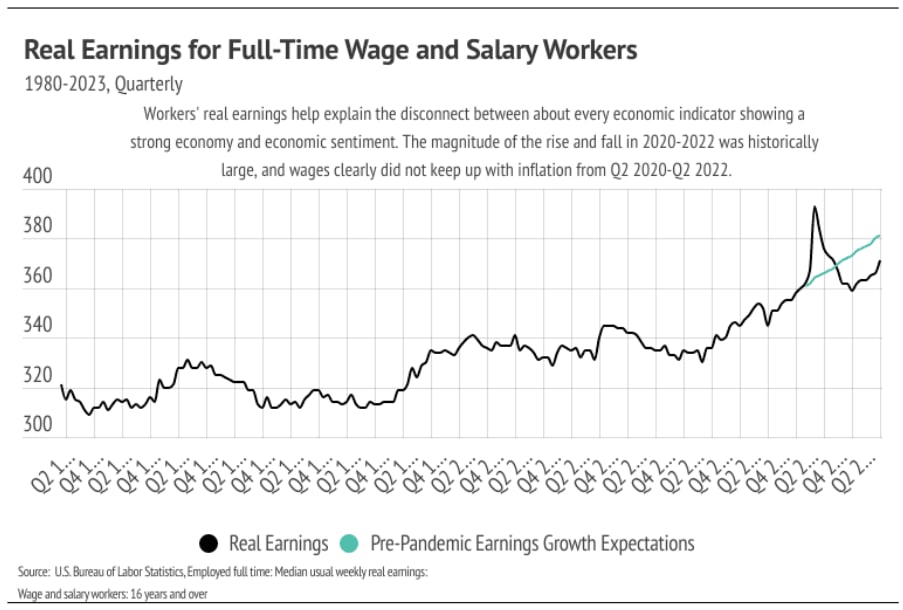
  • Consumer confidence has only recently begun climbing despite nearly every economic indicator showing a strong U.S. economy for some time. This, of course, largely can be explained by inflation and the recent improvement in real earnings (that is, inflation-adjusted earnings).

Will consumer confidence bring back the housing market?

  • Federal Reserve maintains benchmark rate at 5.25% to 5.50%, signaling confidence in current economic conditions.
  • Rate cuts expected closer to summer rather than spring, as current rate levels seem effective in maintaining stability.
  • Inflation is decreasing, unemployment remains low at 3.7%, and recession fears are diminishing, indicating a soft landing for the economy.
  • Despite hopes for a warmer housing market in Q1 2024, slower growth expected due to steady mortgage rates around 6.5%, still too high for widespread market participation.
  • Potential positive impact if rates drop further, potentially increasing market activity by price more participants into the housing market.
  • Recent positive changes in workers' real earnings contribute to improved economic sentiment, potentially benefiting the housing market.
  • Regional variations exist, with higher-priced regions experiencing greater impact from mortgage rate hikes compared to less expensive markets.
  • Continuous monitoring of housing and economic markets to provide informed guidance for buying or selling decisions.

BIG STORY DATA

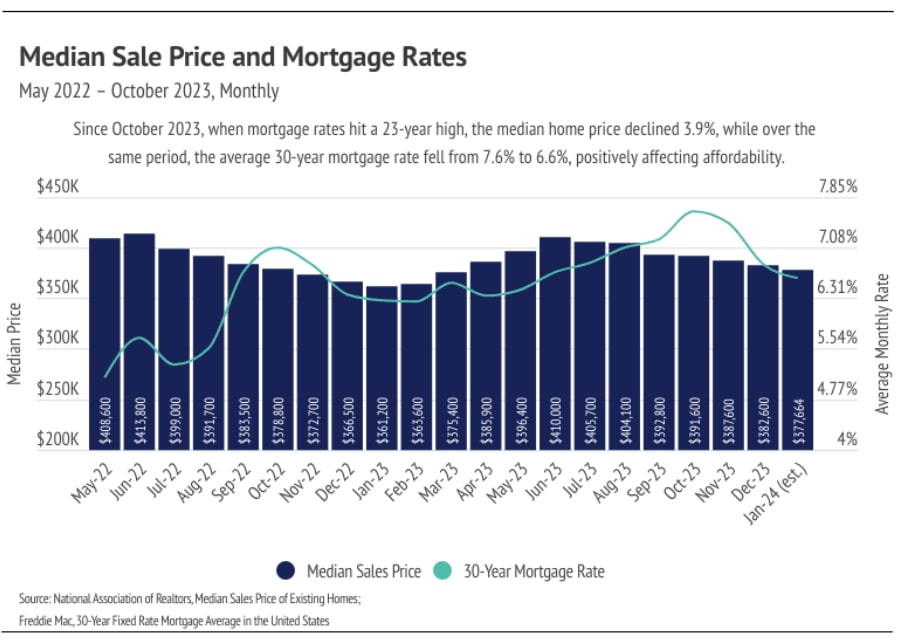
Chart of monthly U.S. home prices and 30-year mortgage rates, May 2022 to January 2024.

Bar chart of monthly mortgage costs, peaking in October 2023 before falling to an estimated $2,417 in January 2024.

Area chart comparing weekly 15-year and 30-year fixed mortgage rates, January 2022 to January 2024.

Chart of existing home sales and housing inventory from June 2021 to December 2023, showing sales declining as inventory grows.

Line chart of months of housing supply, February 2020 to December 2023, ending at 3.2 months.

LOCAL LOWDOWN

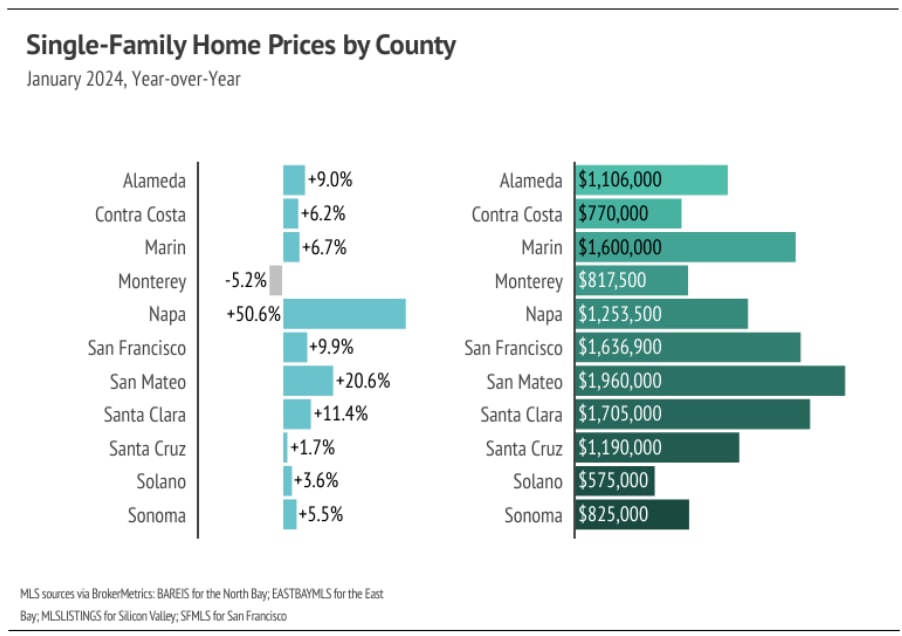
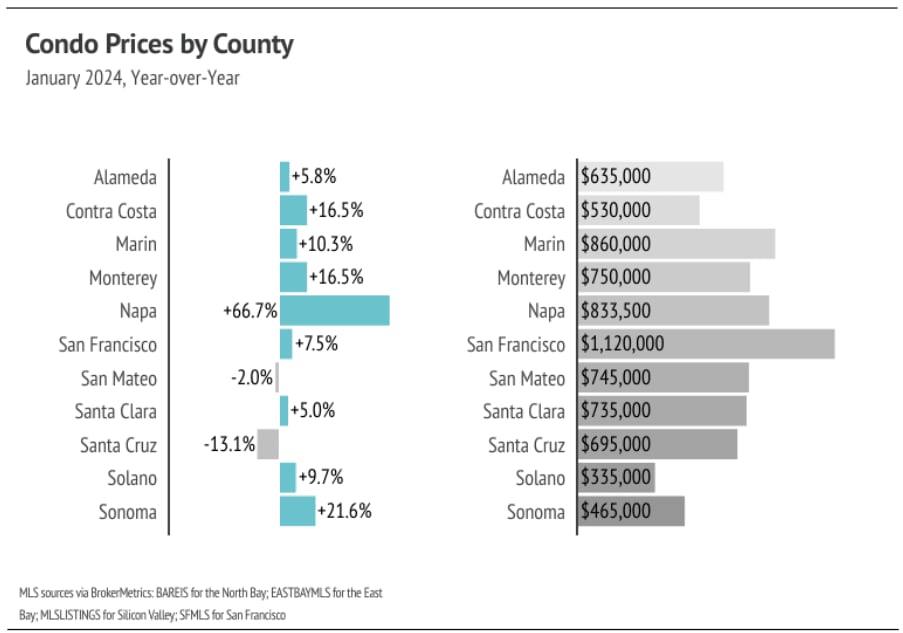
  • Year over year, the median single-family home and condo prices rose across most Bay Area counties in January. Low inventory and high mortgage rates have been the market’s driving factors, and we expect more buyers and sellers to come to the market in the spring as mortgage rates decline further.
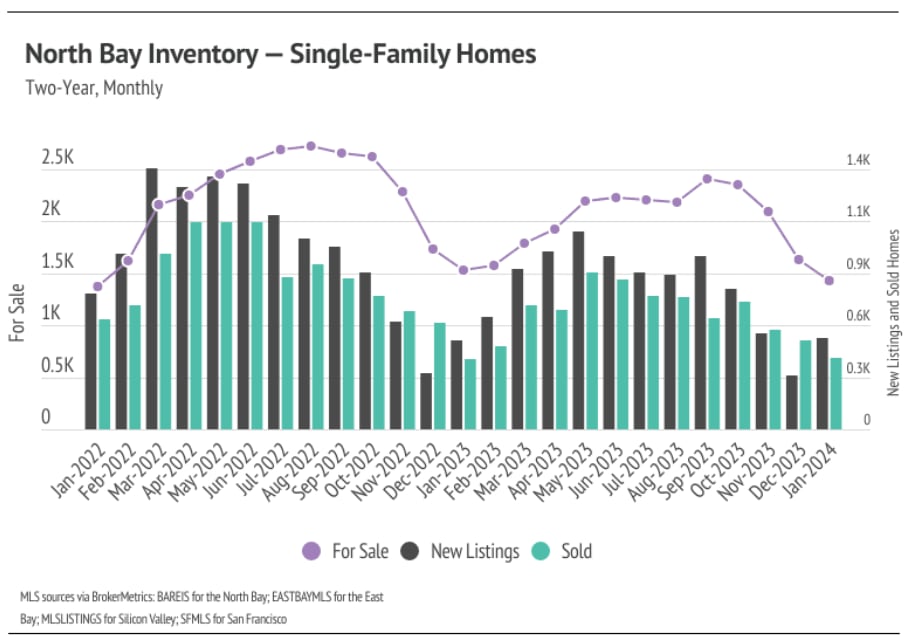
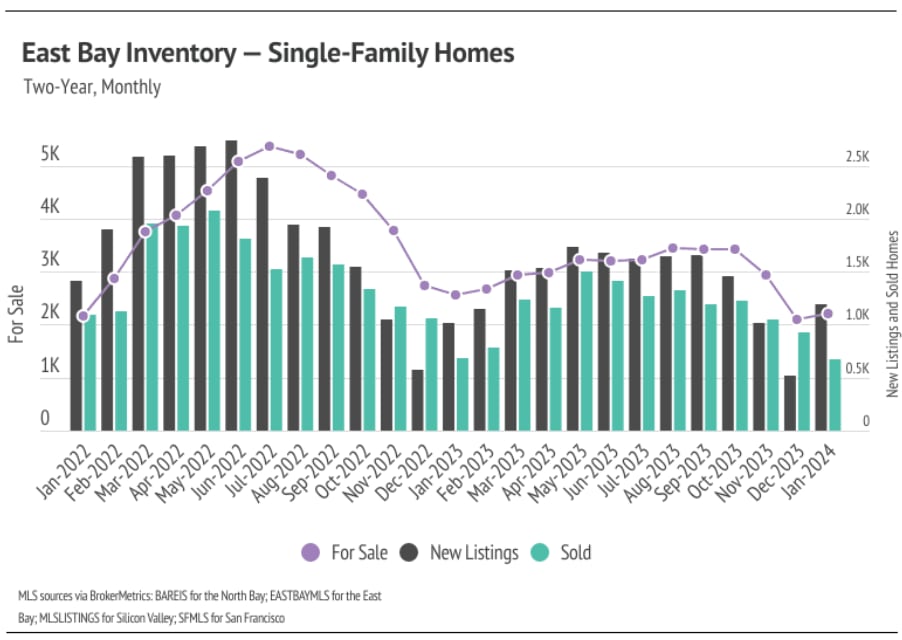
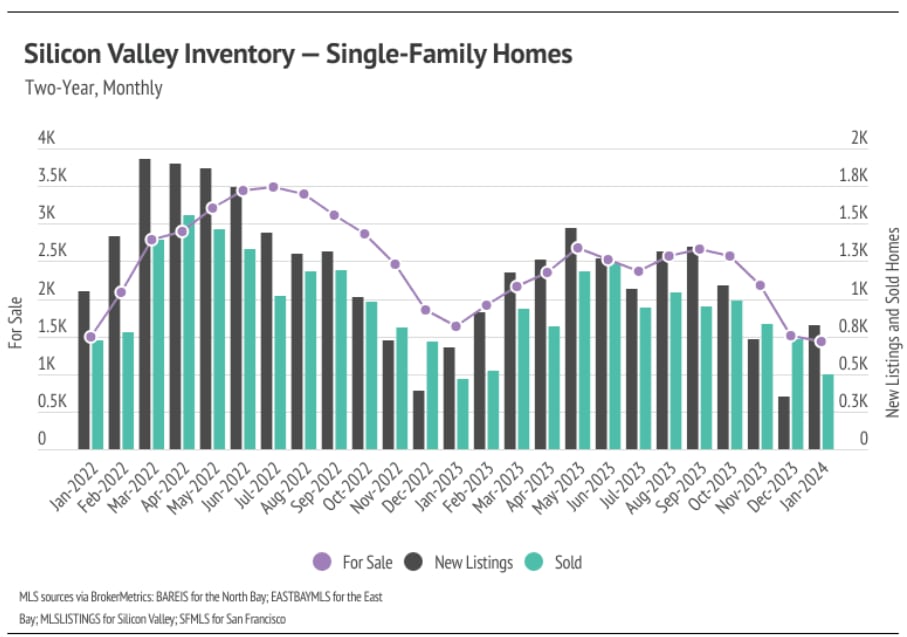
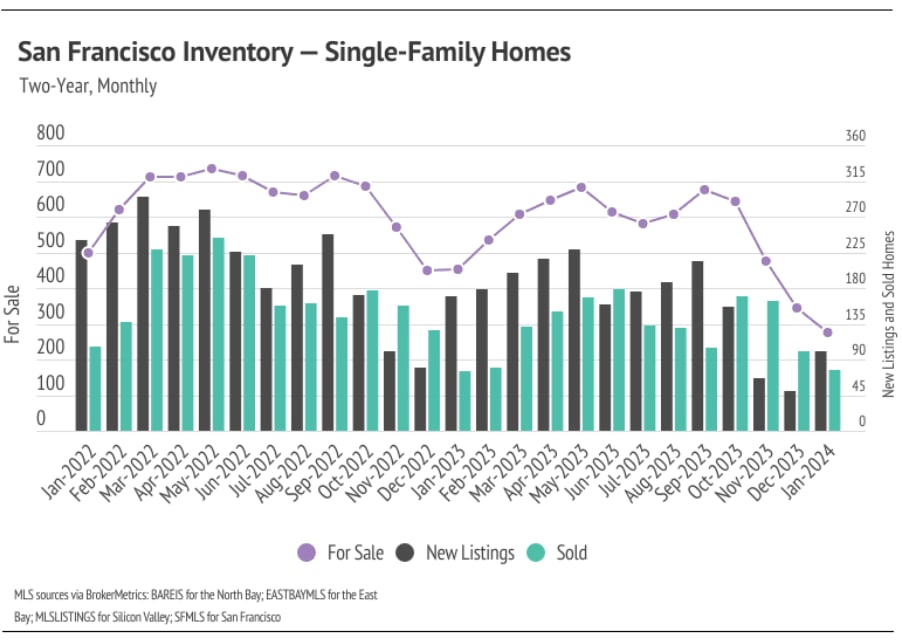
  • Active listings in the Greater Bay Area fell 3% month over month, even as new listings jumped 124%. As mortgage rates drop, we will likely see more new listings in the first quarter, which should help drive more sales.
  • Months of Supply Inventory rose slightly from December 2023 to January 2024, as new listings outpaced sales. However, MSI still indicates a sellers’ market for single-family homes.

Months of Supply Inventory in January 2024 indicated a sellers’ market

  • Months of Supply Inventory (MSI) measures housing market balance.
  • Long-term average MSI in California is around three months, indicating balance.
  • MSI below three signals a sellers' market; above three suggests a buyers' market.
  • Bay Area markets generally favor sellers with low MSIs.
  • San Francisco's MSI fluctuated between buyers' and sellers' markets over the past year.
  • Most Bay Area counties have MSI below three months for single-family homes, except Napa.
  • Condo markets are mostly balanced.
  • Percent of list price received indicates market demand.
  • Sellers typically receive lower percentages during winter months.
  • January 2024 saw higher SP/LP ratios in most Bay Area counties compared to last year.
  • Sellers expected to receive a higher percentage of list price in 2024.

Chart of full-time workers’ real earnings, with a black earnings line and green pre-pandemic growth expectations line.

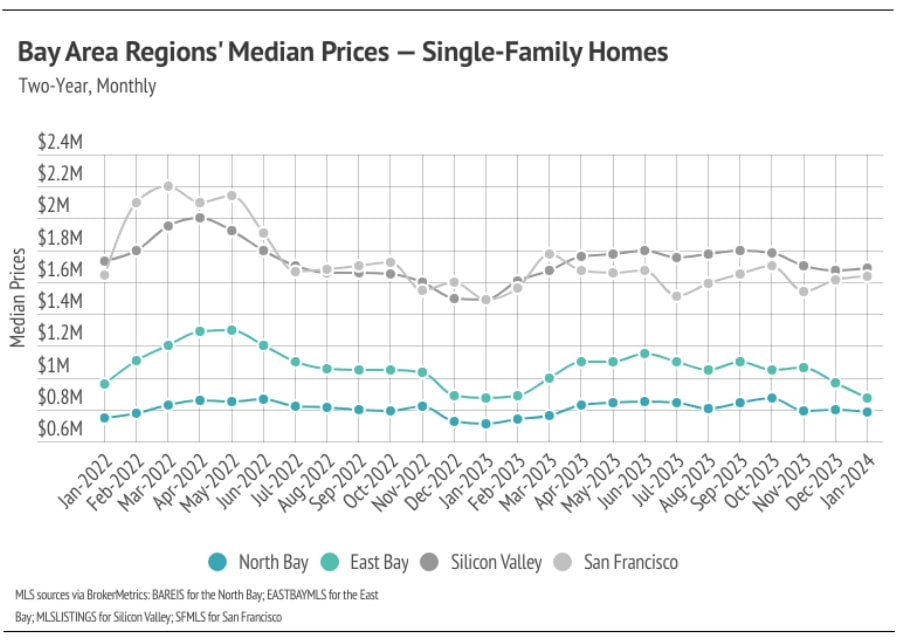
Line chart compares monthly median single-family home prices in four Bay Area regions from January 2022 to January 2024.

Chart of January 2024 home prices and year-over-year changes across 11 Bay Area counties.

Line chart comparing monthly condo median prices in four Bay Area regions from January 2022 to January 2024.

Chart comparing January 2024 condo prices and year-over-year changes across 11 California counties.

North Bay single-family home inventory chart, with monthly for-sale, new-listing, and sold figures from 2022 to 2024.

Chart of East Bay single-family home inventory, new listings, and sales from January 2022 to January 2024.

Chart of Silicon Valley single-family homes for sale, new listings, and sales from January 2022 to January 2024.

Chart of San Francisco single-family home inventory, new listings, and sales, January 2022 to January 2024.

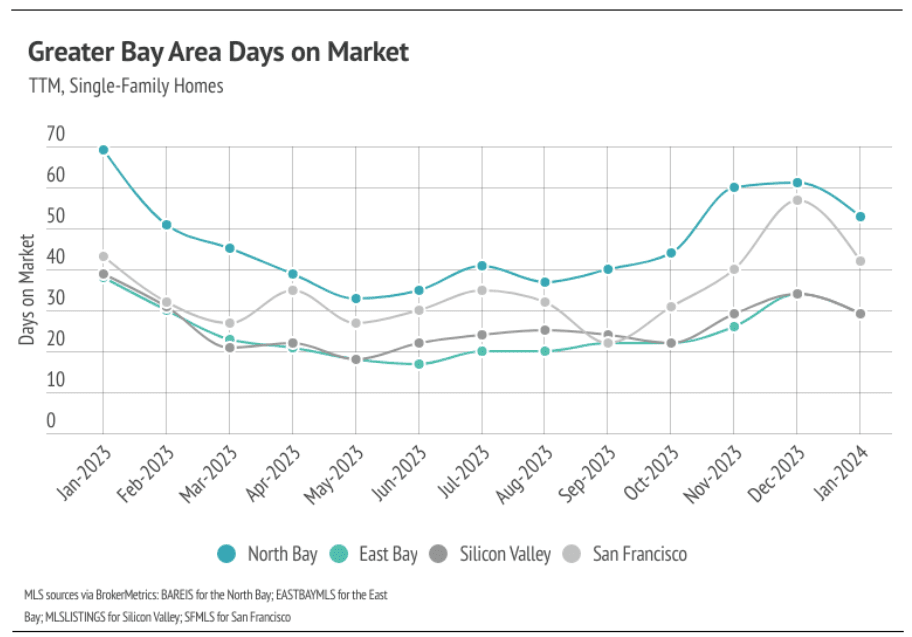
Line chart comparing monthly days on market across four Greater Bay Area regions from January 2023 to January 2024.

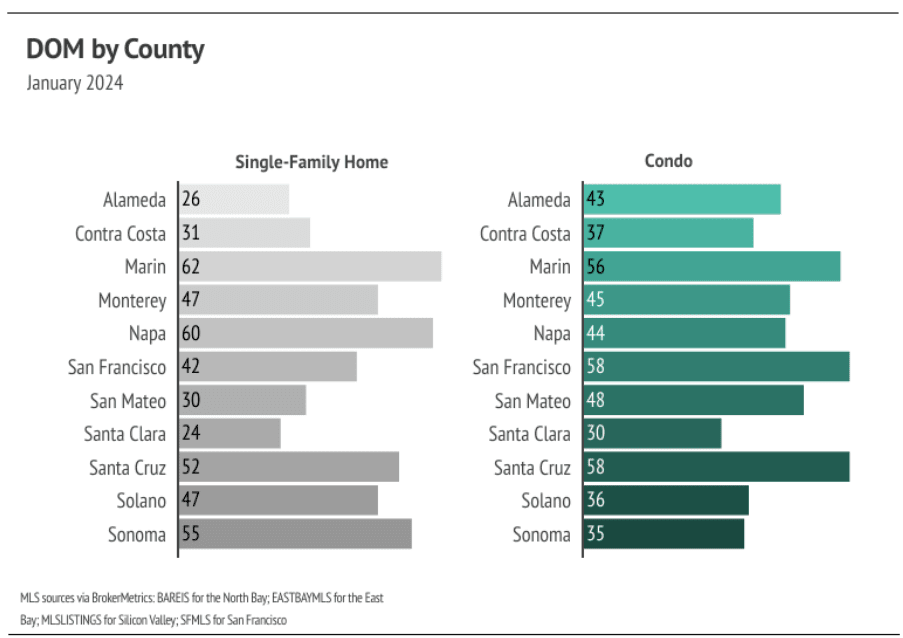
Bar chart comparing January 2024 days on market by county for single-family homes and condos.

Line chart comparing 2023–January 2024 months of supply for single-family homes in four Bay Area regions.

January 2024 months-of-supply chart by county for single-family homes and condos.


CLINK LINKS and FOLLOW US for more updates!
 
Visit our Page: Milestone Realty - Buy & Sell in Greater Silicon Valley, Almaden & Willow Glen (remilestone.com)


Let's Talk

You’ve got questions and we can’t wait to answer them.
Set Up Your Search for New Homes

Check It Out