April '25 Bay Area Real Estate Market Update

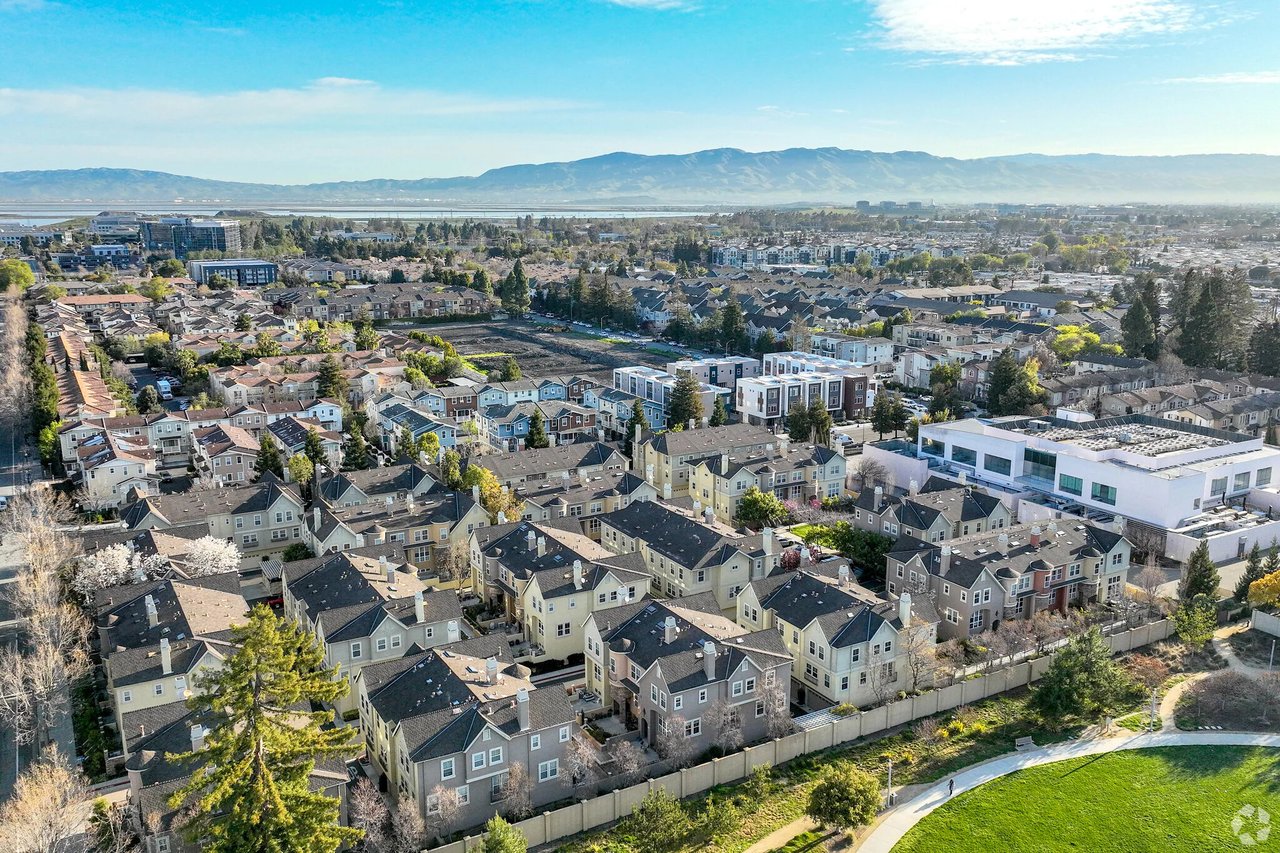
Greater Bay Area market update over an aerial view of the coast, waterways, and city.
THE BIG STORY
 
Quick Take:
  • Mortgage rates have ticked up slightly over the course of the past year, and coincidentally, so has the median sale price of a home in the US.
  • According to Freddie Mac, the average 30-year mortgage rate is 6.62%, as of April 10th.
  • Although affordability remains an issue throughout the country, the median monthly P&I payment has declined by over $100 on a year-over-year basis, representing a considerable savings for consumers!
  • We are seeing the trend of more new listings hitting the market continue, as we saw roughly 10% more new listings added in March when compared to a year ago.
HOME SALES ARE ROUGHLY STAGNANT COMPARED LAST YEAR

📉 Sales Slightly Down, But Inventory Up

February 2025 saw a modest dip in home sales compared to last year (4.26M vs. 4.38M), but inventory has grown—1.24M homes on the market this February vs. 1.06M a year ago. More inventory = more options for buyers.

🏘️ Power Shift Toward Buyers?

With 10% more new listings added in March 2025 compared to March 2024, we may be seeing the early signs of a market shift toward buyers. Listings may start sitting longer, giving buyers more negotiating room.

💸 Sellers Adjusting to Rate Reality

Sellers appear to be coming to terms with the fact that significantly lower mortgage rates may not return anytime soon. Many are choosing to list now rather than wait it out.

📉 Payments Down Despite Rising Rates

Interestingly, median monthly mortgage payments fell by nearly 5%, even as prices and rates rose slightly. This likely reflects homeowners who locked in higher rates in late 2023 and recently refinanced into lower rates, freeing up an extra ~$100/month in household budgets.

🏦 Fed Holds Steady

The Federal Reserve is maintaining current interest rates, signaling no major cuts are on the horizon. They're also continuing to offload mortgage-backed securities gradually.

Line chart comparing existing home sales and inventory from February 2024 to February 2025.

Chart of Federal Reserve mortgage-backed securities holdings, rising to a 2022 peak before declining through 2025.

Bar chart of median monthly principal and interest payments, January 2024–January 2025; January 2025 is $2,148.

Chart comparing monthly median home sale prices and 30-year mortgage rates, February 2024 to February 2025.

Line chart of monthly U.S. new listings from March 2018 to March 2025, showing seasonal peaks and declines.

THE LOCAL LOWDOWN

Quick Take:

  • Housing markets across the Bay Area show mixed signals, with single-family homes outperforming condos in most regions.
  • Inventory trends vary significantly by region, with Silicon Valley seeing increases while San Francisco continues to struggle with low supply.
  • Single-family homes in most Bay Area regions remain in a seller's market, while the condo market generally favors buyers with higher months of supply inventory.
  • Days on market vary dramatically across the Bay Area, from just 8-16 days in Silicon Valley to significantly longer timeframes in other regions.

BAY AREA HOME VALUES SHOW DIVERGENT TRENDS ACROSS REGIONS

The Bay Area real estate market is showing varied performance across its different regions. Silicon Valley continues to be a hotspot for growth, with Santa Clara County experiencing an impressive 11.58% year-over-year increase in median sale price in March. San Mateo and Santa Cruz counties also saw healthy increases of 3.75% and 7.27%, respectively. In contrast, the East Bay market has cooled somewhat, with year-over-year median sale prices dropping by 4.41% in Alameda County and 7.44% in Contra Costa County, though month-over-month trends remain positive. San Francisco presents a tale of two markets, with single-family homes maintaining their value (increasing 6.63% over four years) while condo values have declined by 12.52% over the same period, highlighting buyer preference for detached homes over shared buildings.

Inventory trends vary sharply across the region. Silicon Valley and the East Bay saw major year-over-year growth in single-family home listings (up 40.05% and 47.79%, respectively), while San Francisco and the North Bay continue to face low supply.

Homes are selling fast in many areas — just 8 days on average in Santa Clara and 12–13 days in the East Bay. San Francisco is seeing strong competition too, with homes selling for 114.7% of asking price. In contrast, North Bay properties are spending more time on the market than last year.

Single-family homes remain a seller’s market across most of the Bay Area, while condos lean toward a buyer’s market, with inventory levels over 3 months in many counties.

LOCAL LOWDOWN DATA

Line chart comparing monthly condo days on market in Alameda and Contra Costa, March 2023 to March 2025.

Chart comparing monthly days on market for single-family homes in Alameda and Contra Costa counties, March 2023–March 2025.

East Bay condo inventory chart comparing monthly new, sold, and for-sale listings from May 2023 to March 2025.

East Bay single-family inventory chart comparing new, sold, and for-sale listings, March 2023–March 2025.

Line chart comparing monthly condo supply in Alameda and Contra Costa, March 2023–March 2025.

Chart of monthly East Bay condo prices, comparing Alameda and Contra Costa from March 2021 to March 2025.

East Bay condo months of supply chart comparing Alameda and Contra Costa from March 2023 to March 2025.

Line chart comparing monthly single-family home supply in Alameda and Contra Costa, March 2023 to March 2025.

Line chart of monthly condo days on market in four North Bay counties, March 2023–March 2025; Napa spikes to about 190 days.

North Bay condo inventory chart showing monthly new listings, sold listings, and listings for sale from March 2023 to March 2025.

Chart of North Bay single-family home listings from March 2023 to March 2025, comparing new, sold, and for-sale inventory.

Bar chart comparing year-over-year median price changes across four North Bay counties, April 2024 to March 2025.

Line chart of North Bay condo prices by county, March 2022–March 2025; Napa prices fluctuate most.

Bar chart comparing year-over-year single-family home price changes in four North Bay counties, April 2024–March 2025.

Line chart comparing monthly condo inventory supply in Sonoma, Marin, Solano, and Napa from March 2023 to March 2025.

Line chart of North Bay single-family home supply by county, March 2023–March 2025; Napa is consistently highest.


Let's Talk

You’ve got questions and we can’t wait to answer them.

Set Up Your Search for New Homes

Check It Out