-
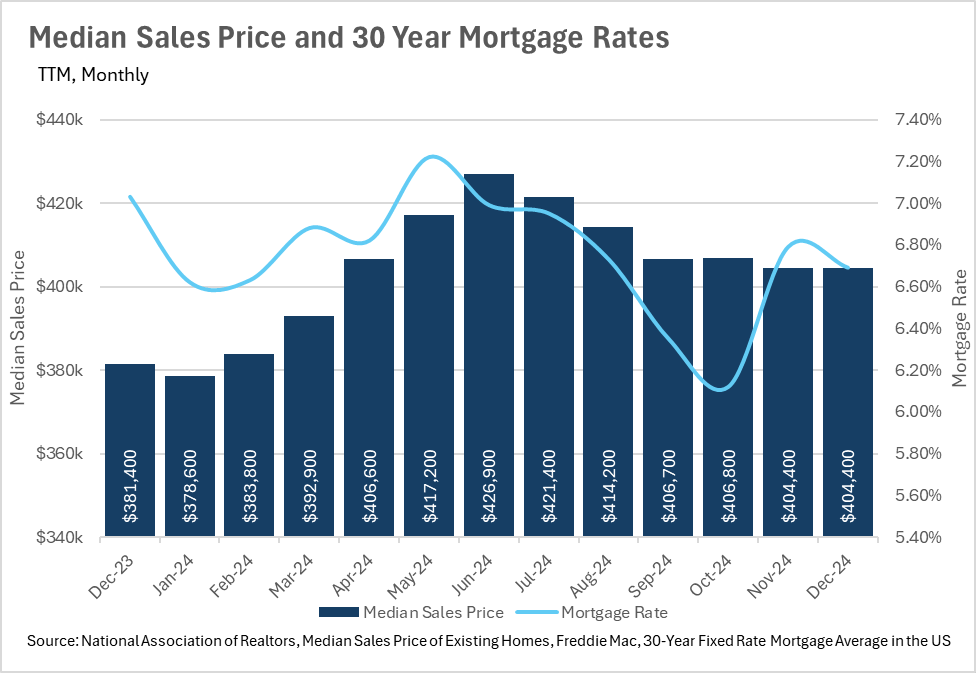
Mortgage rates have ticked back up to roughly the same levels, as they were at prior to the Fed issuing its first rate cut in September.
-
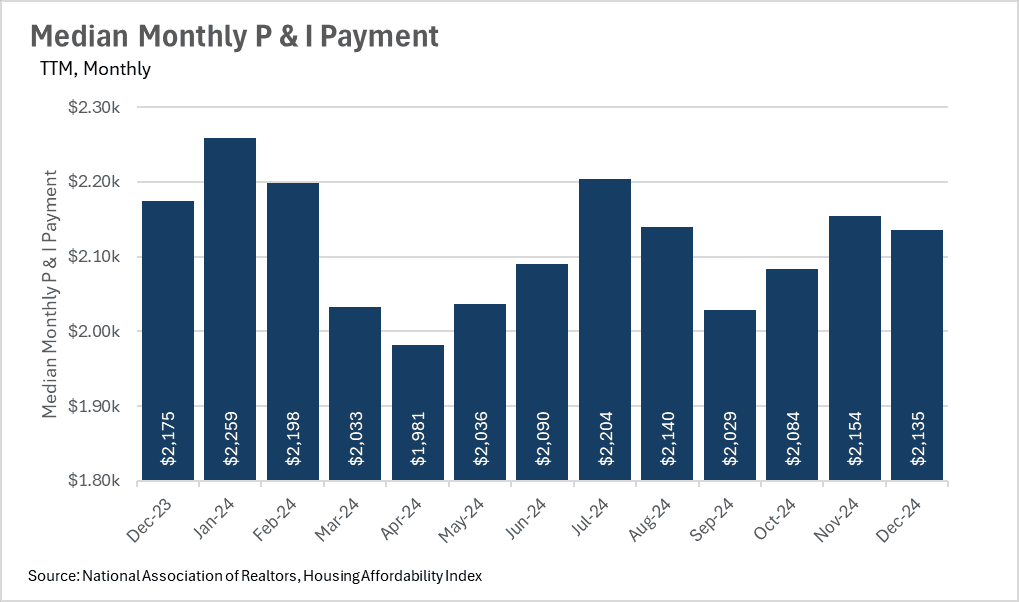
Although housing affordability remains a concern, things have gotten slightly better year-over-year, with median monthly P&I payment decreasing by 1.84%.
-
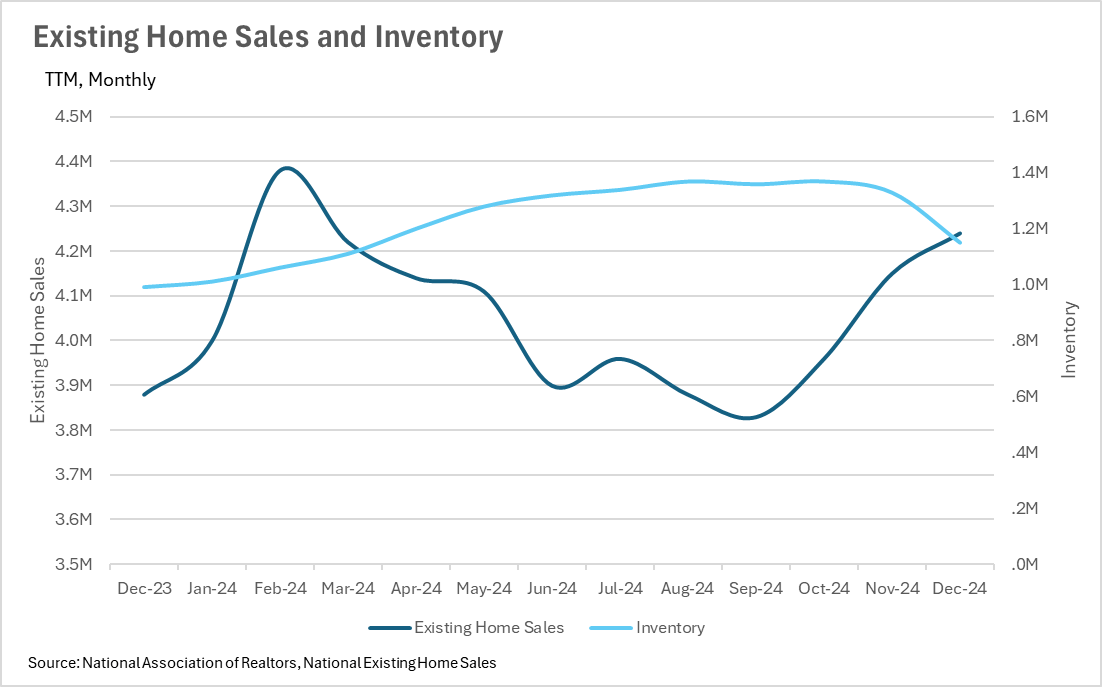
Year-over-year growth in inventory is outpacing existing home sales by roughly 7%, meaning we could see affordability begin to increase over the coming months.
Mortgage rates have returned to pre-rate cut levels
One very interesting phenomenon that we’ve seen play out over the past few months is that interest rates have largely returned to the levels that we saw prior to the Fed’s first rate cut in September. Unfortunately this is not what the market at large was expecting to see, since mortgage rates typically move in tandem with the Federal Funds rate. However, this suggests that the lending market expects the rate cuts that we have seen recently to be short lived, meaning that the lending market is expecting the Fed to begin increasing rates again within the coming years. This could be due to a variety of reasons, but inflation is the most likely culprit for rate hikes, as it has remained rather stubborn since it first became an issue in 2022.
Inventory is finally starting to build throughout the US
As we all know, inventory levels have been an issue Post-COVID, across the entire country, with many areas not having nearly enough inventory to support buying demand. This, in turn, helped to push up the values of homes nationwide.
It’s important to note though, that we’re beginning to see inventory growth outstrip existing home sale growth, as in December, inventory grew by 16.16% on a year-over-year basis, whereas existing home sales grew by 9.28% year-over-year.
Median sale prices continue to rise, despite interest rate headwinds
Many buyers still have the mortgage rates that they saw in 2021 and 2022 at the top of their mind, making it difficult for them to justify locking in a mortgage in the 6%-7% ranges that we’ve been seeing over the past couple of years. Despite many buyers sitting on the sidelines, and waiting for lower rates, we’re still seeing the median sale price of homes increase. In both the months of November and December, the median sale price of a home in the United States was $404,400. This represents an increase in value of 6.03%, when compared to the December 2023 median sale price of $381,400. This is slightly concerning, given that the growth in median sales price continues to outstrip the growth in inflation, with December’s year-over-year CPI figures coming in at 2.9%.
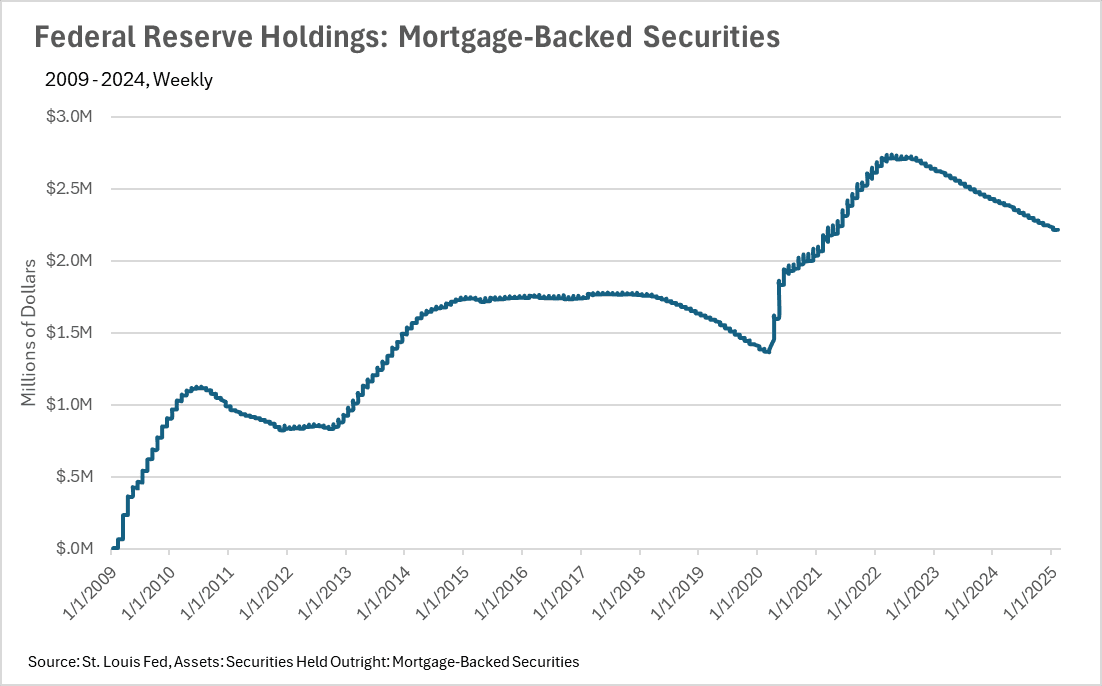
The Fed continues to unwind its mortgage-backed securities
As many of us know, in addition to the Federal Funds Rate, the Fed also has control over its own balance sheet. Throughout the COVID crisis, the Fed ramped up its purchase of mortgage backed securities at a rate we haven’t seen since the Great Financial Crisis. However, the Fed has since been unwinding its holdings of MBS’s at a steady rate, since late 2022, which it continues to this day.
How does all of this effect my local market
Although it’s great to know what’s happening at a national level, real estate is an incredibly localized industry. There are areas throughout the country that are doing considerably better or worse than the nation at large. To ensure you’re informed on the happenings at both a national level and a local level, we’ve included our local lowdown below. In our local lowdown, you’ll find the in-depth coverage you need to stay in tune with your area. As always, we’ll be monitoring the housing market and the economy from both a macro and micro level, and report back to ensure you’ve got the data you need to make the best decisions possible!
BIG STORY DATA
THE LOCAL LOWDOWN
-
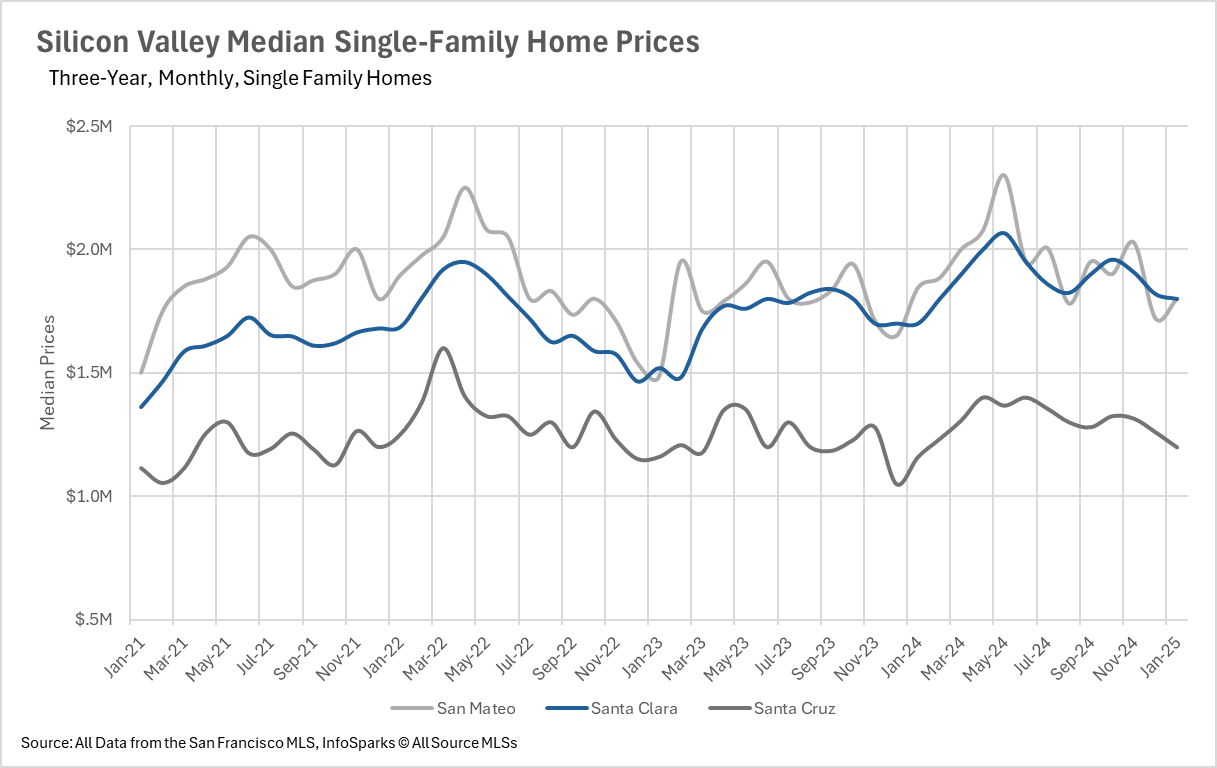
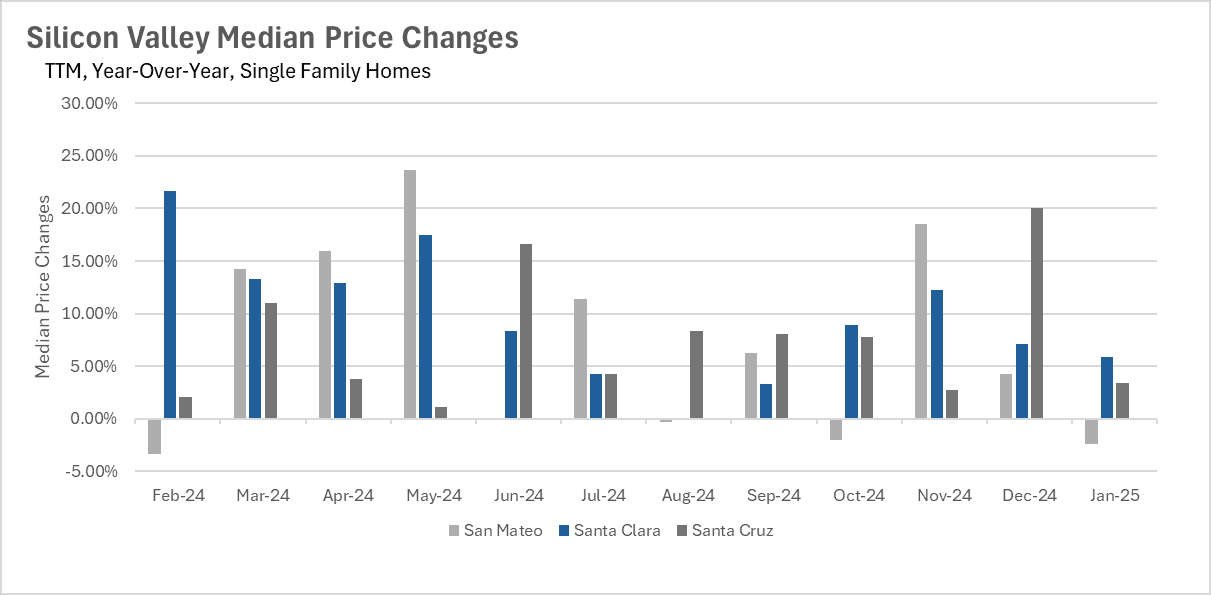
Despite an incredibly strong year in terms of value appreciation, median sale prices in the month of January increased on a year-over-year basis in most of Silicon Valley.
-
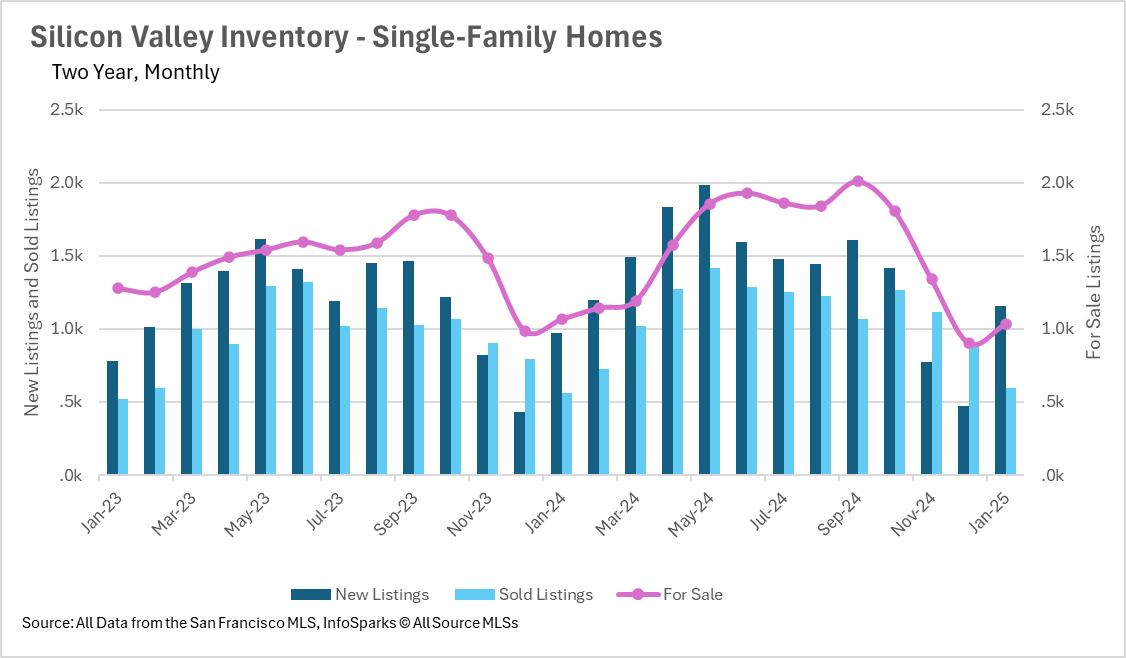
Although a lot of new single family home inventory was added in Silicon Valley throughout January, total active inventory is still slightly trailing last year’s figures.
-
New listings continue to get snapped up incredibly quickly, as buyers are forced into fierce competition.
Single-family home prices continue to grow in the Silicon Valley
Much like most of the rest of the Bay Area, Silicon Valley seemed to be largely unaffected by the high mortgage rates that we saw throughout this year. In fact, almost every month in 2024 saw year-over-year growth in two or more counties. This trend has continued into January, with Santa Clara and Santa Cruz Counties experiencing 5.88% and 3.36% year-over-year increases in median sales prices, while San Mateo County saw a 2.44% decrease.
Although mortgage rates have ticked back up considerably after the dip we saw after the Fed rate cuts in the Fall, buyers in Silicon Valley do not seem to be scared of the higher cost of capital. If we see further rate cuts that lead to lower mortgage rates in 2025, Silicon Valley might be set for another explosion in terms of pricing!
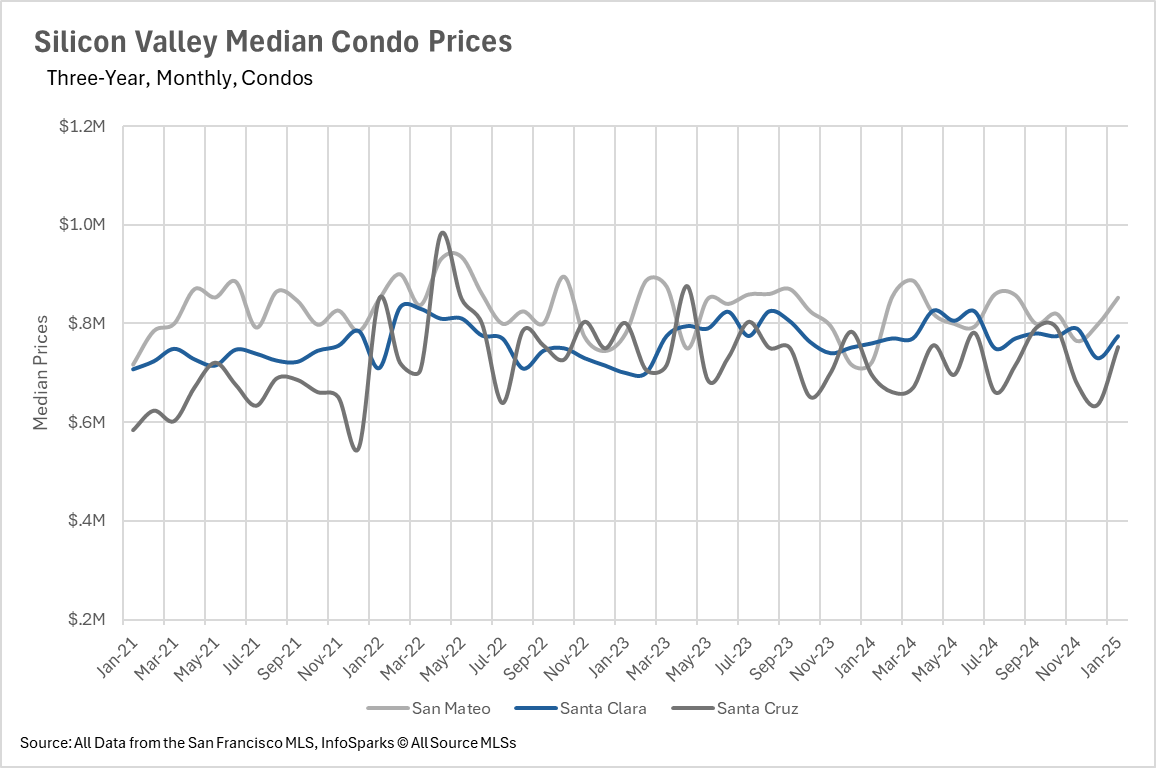
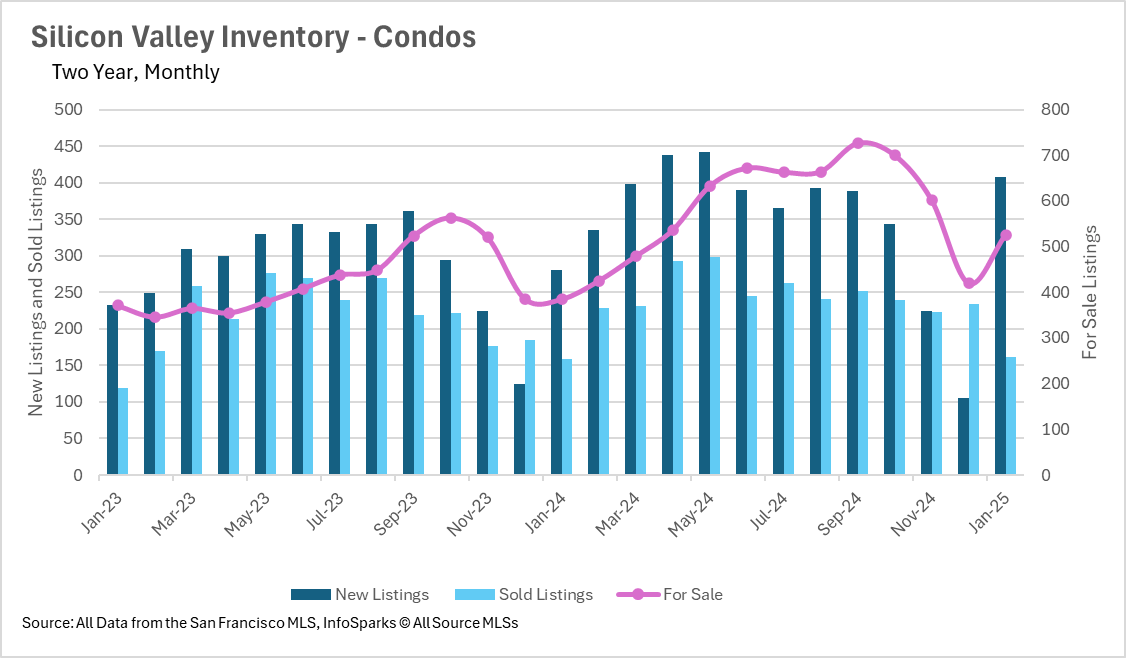
Condo inventory begins to build in Silicon Valley
Although active inventory for single-family homes in Silicon Valley is roughly flat year-over-year, we are seeing inventory start to build in terms of condos, with active inventory increasing by 36.62% and new listings increasing by 45.2% on a year-over-year basis. Active condo inventory levels are currently sitting at a level we didn’t see until April of last year. This could mean that there might be some great buying opportunities ahead of us in the condo market!
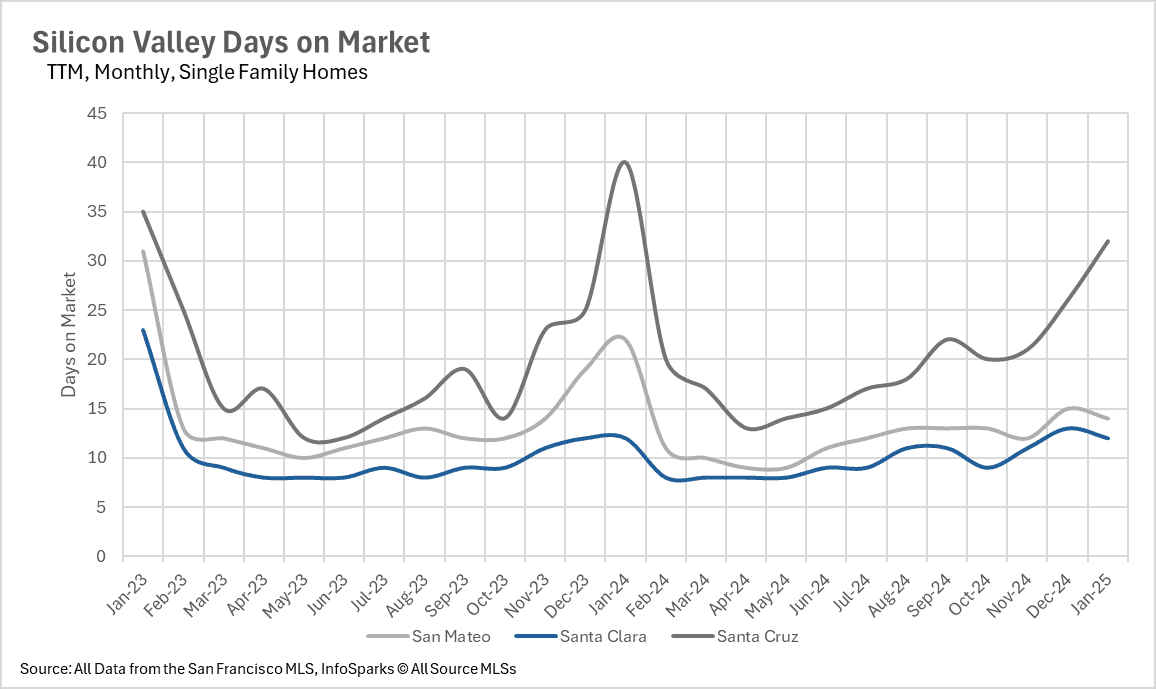
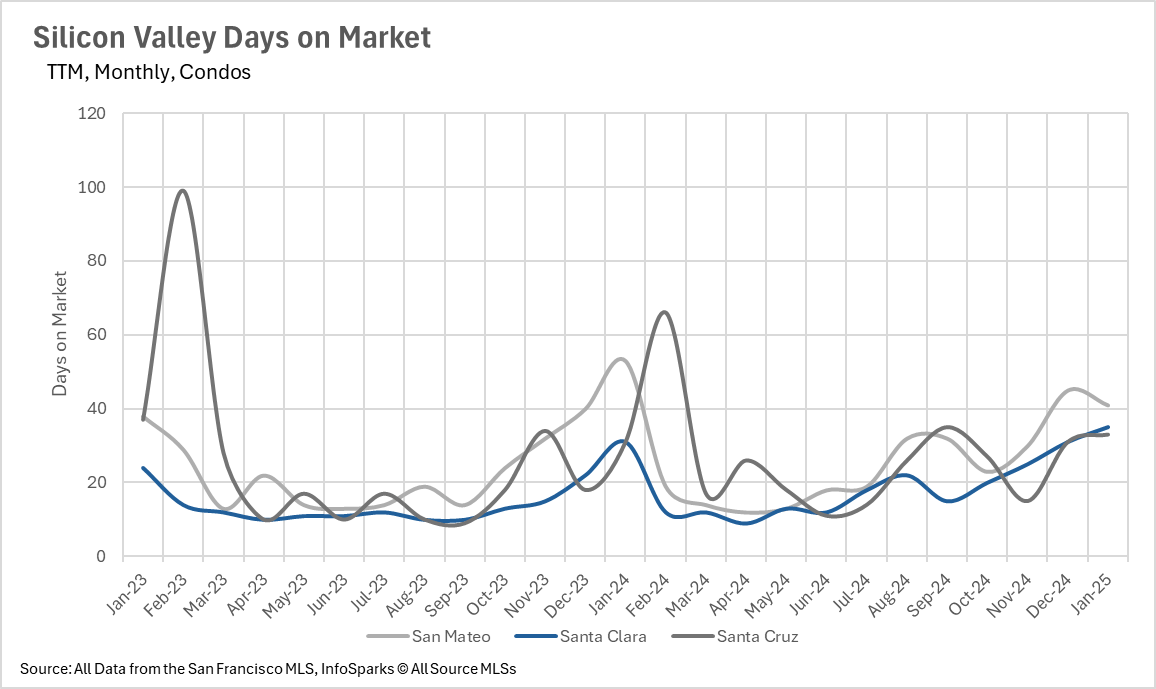
A divergence in the time listings are spending on the market
We’re seeing an interesting divergence in terms of the amount of time new listings are spending on the market when comparing condos and single-family homes. SFH’s are being snapped up incredibly quickly, with the average new listing spending 14 days on the market in San Mateo, 12 days in Santa Clara, and 32 days in Santa Cruz. These numbers represent 36.36% and 20% year-over year declines in San Mateo and Santa Cruz, and no change in Santa Clara. However, condos are spending quite a bit more time on the market, with condos spending about 12.9% and 6.45% more time on the market in Santa Clara and Santa Cruz, when compared to last year.
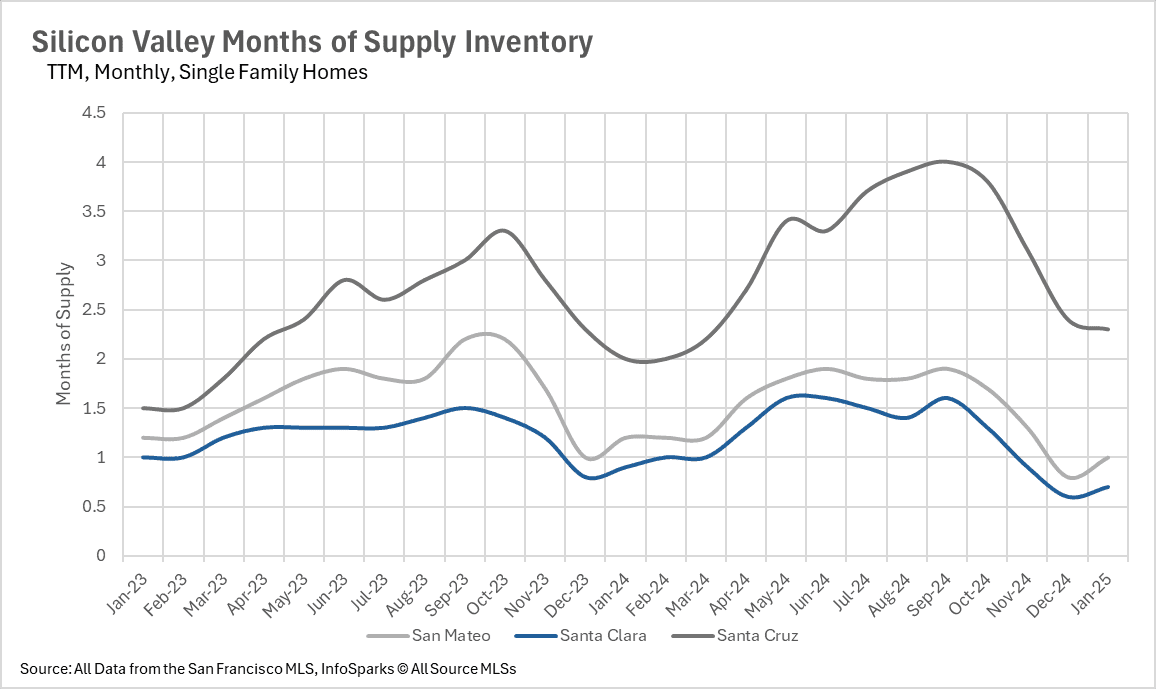
Sellers continue to have bargaining power in Silicon Valley
When determining whether a market is a buyers’ market or a sellers’ market, we look to the Months of Supply Inventory (MSI) metric. The state of California has historically averaged around three months of MSI, so any area with at or around three months of MSI is considered a balanced market. Any market that has lower than three months of MSI is considered a sellers’ market, whereas markets with more than three months of MSI are considered buyers’ markets.
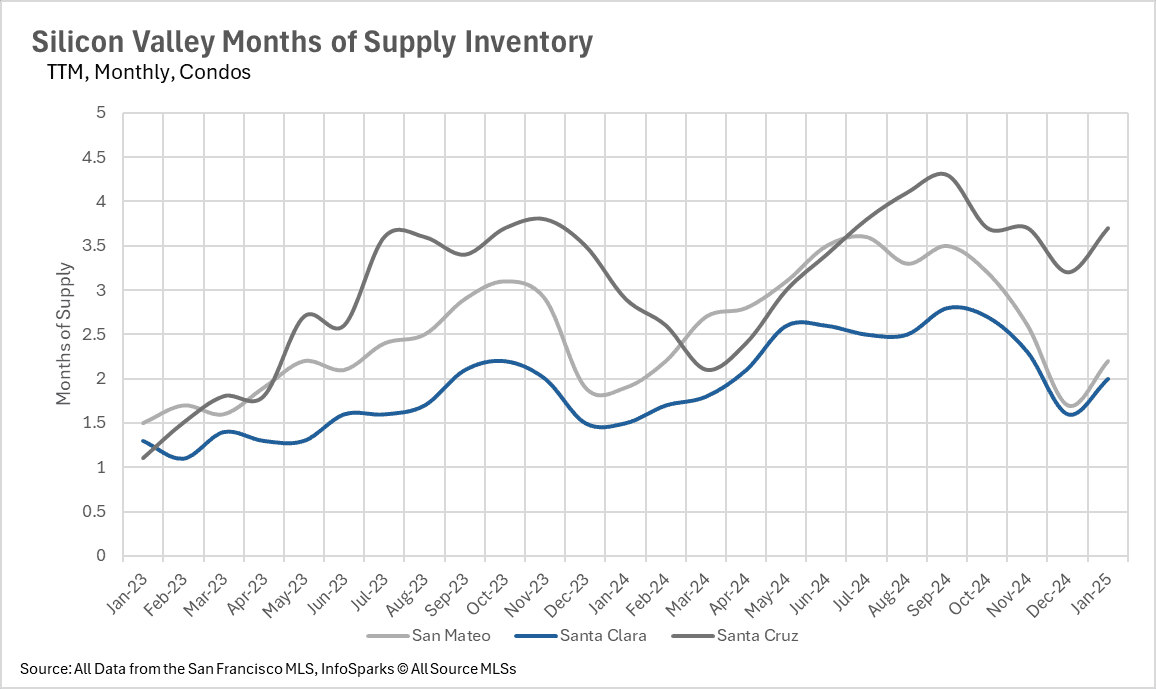
Given this information, the single family home market in Silicon Valley is most definitely a sellers’ market, as there are 1, 0.7, and 2.3 months of inventory on the market in San Mateo, Santa Clara, and Santa Cruz counties, respectively. However, on the other hand, the condo market isn’t as one sided. San Mateo and Santa Clara have 2.2 and 2 months worth of inventory on the market, making them sellers’ markets. Whereas, Santa Cruz has 3.7 months worth of supply on the market, making it a buyers’ market!
LOCAL LOWDOWN DATA
CLINK LINKS and FOLLOW US for more updates!