THE BIG STORY
Quick Take:
-
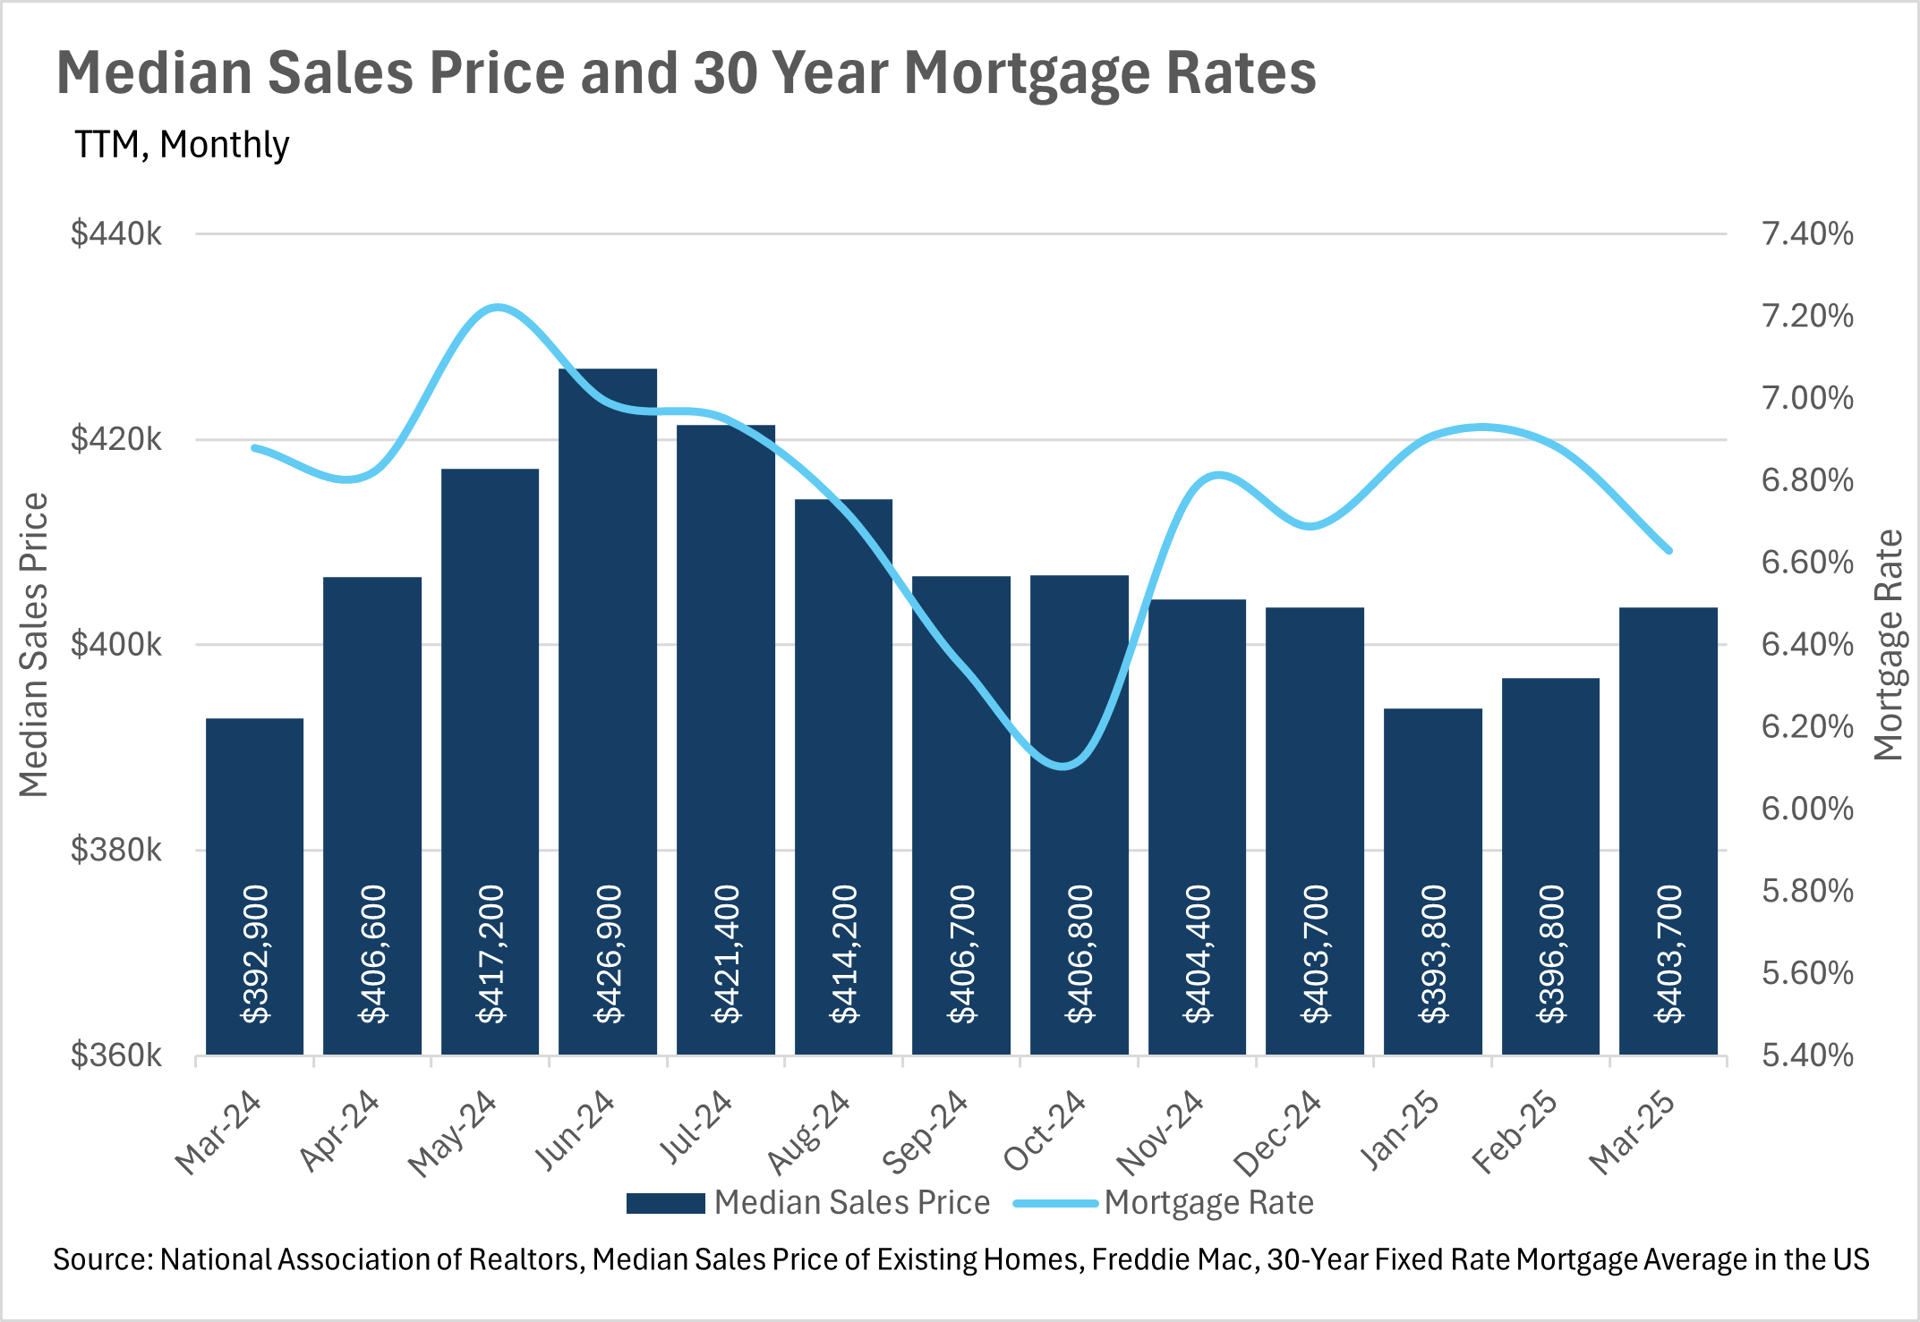
Median purchase price continues to tick up, increasing by 2.75% on a year-over-year basis nationwide.
-
The average 30-year mortgage rate continues to slowly fall, reaching 6.63% in the month of March.
-
The number of sales has declined slightly, while inventory skyrocketed on a year-over-year basis.
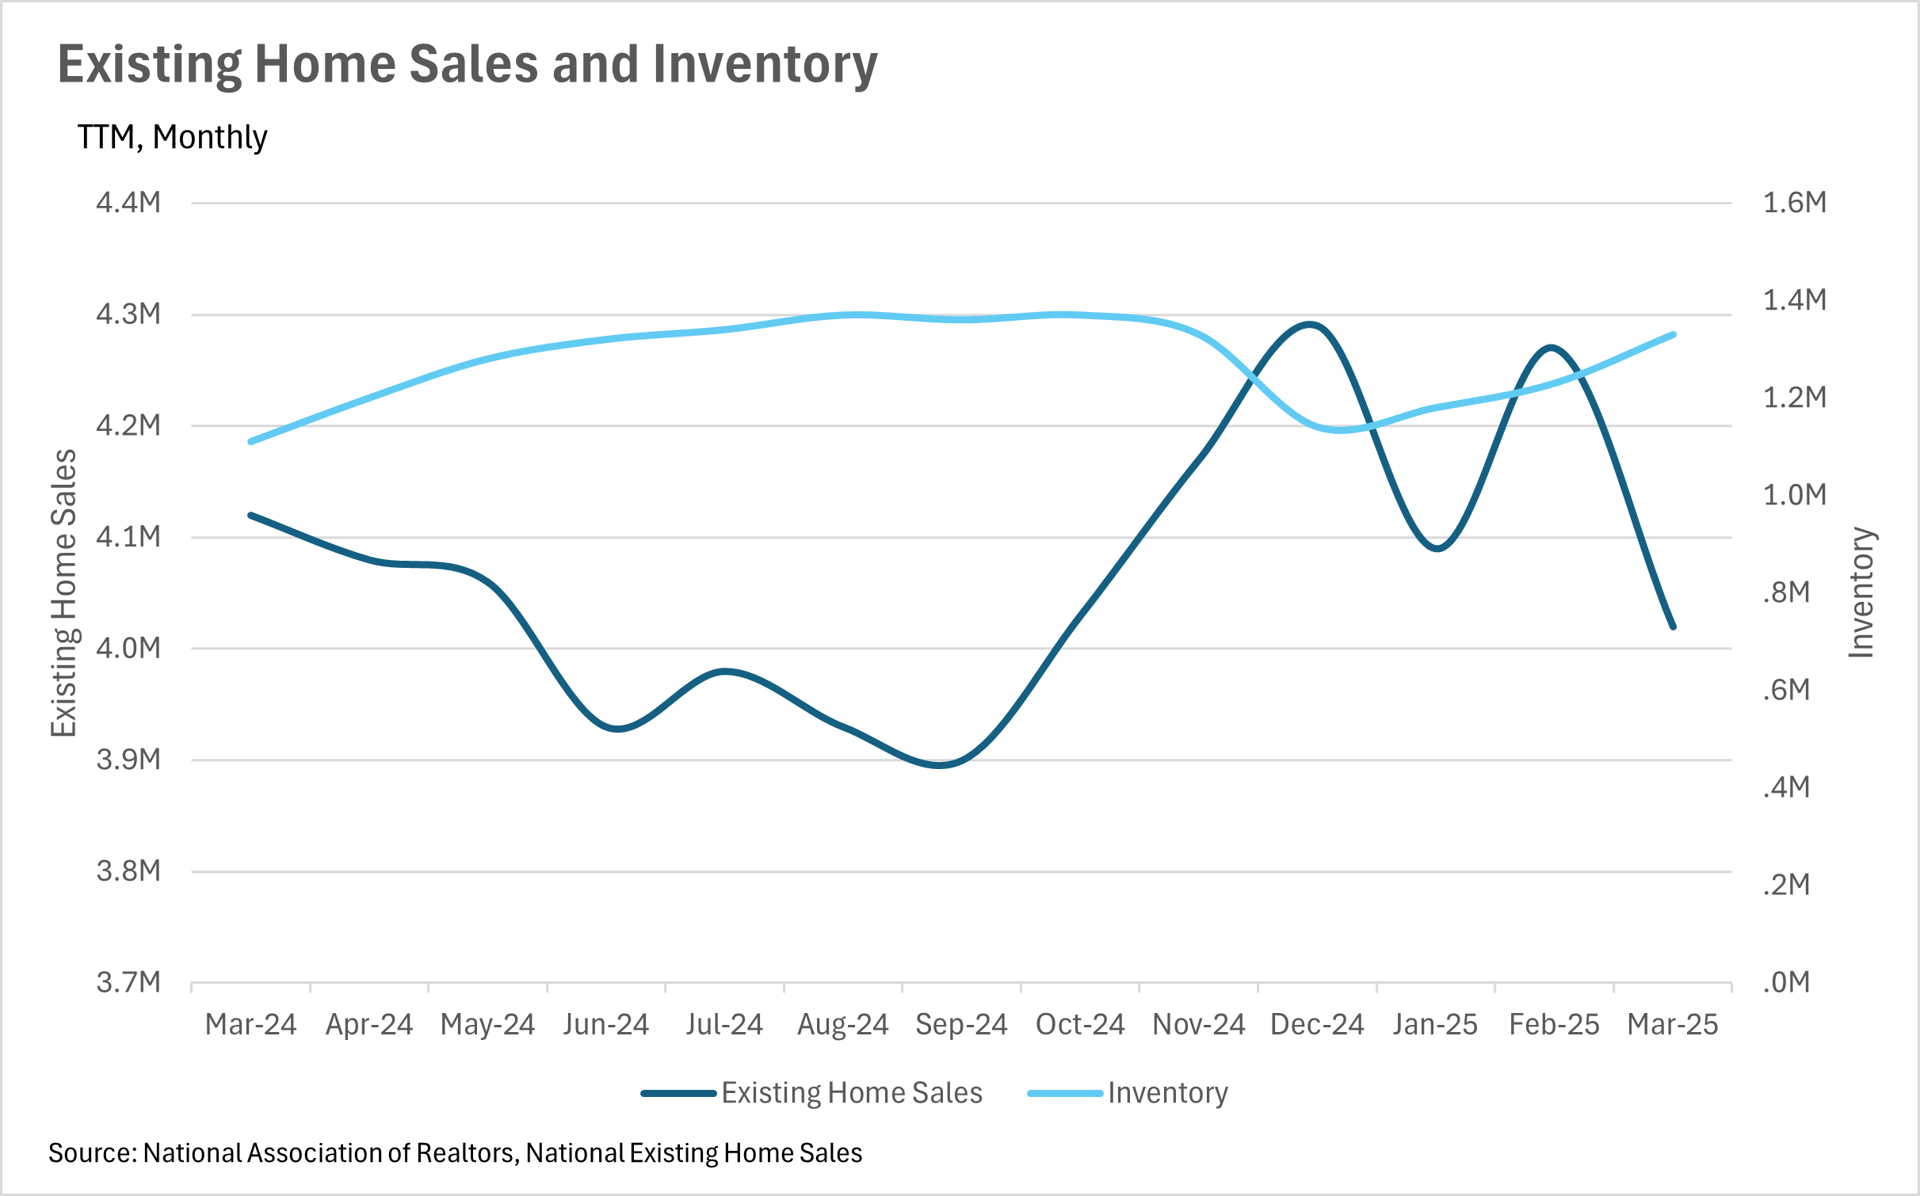
INVENTORIES LEVEL EXPLODE WHILE EXISTING HOME SALES DECLINE SLIGHTLY
Although we’re still at the point in the season where inventories are supposed to build, they have increased by nearly 20% on a year-over-year basis, from 1,110,000 to 1,330,000, showing that people are hesitant to purchase a new home. Additionally, while inventories have been increasing, the number of existing homes being sold has decreased slightly on a year-over-year basis, with March 2025 numbers coming in at 4,020,000, which is 2.43% lower than where they were last year. Across the country, people are becoming more uncertain of whether or not they should move to a new home, and that is very clearly showing!
This data is just for March though; it will be important to pay attention to how the market reacted to the beginning of the trade war when April’s numbers come out in a couple of weeks. While it’s easy to see how things like the stock market and bond market react to big newsworthy events like this, real estate is incredibly illiquid, so it takes some time for things to play out!
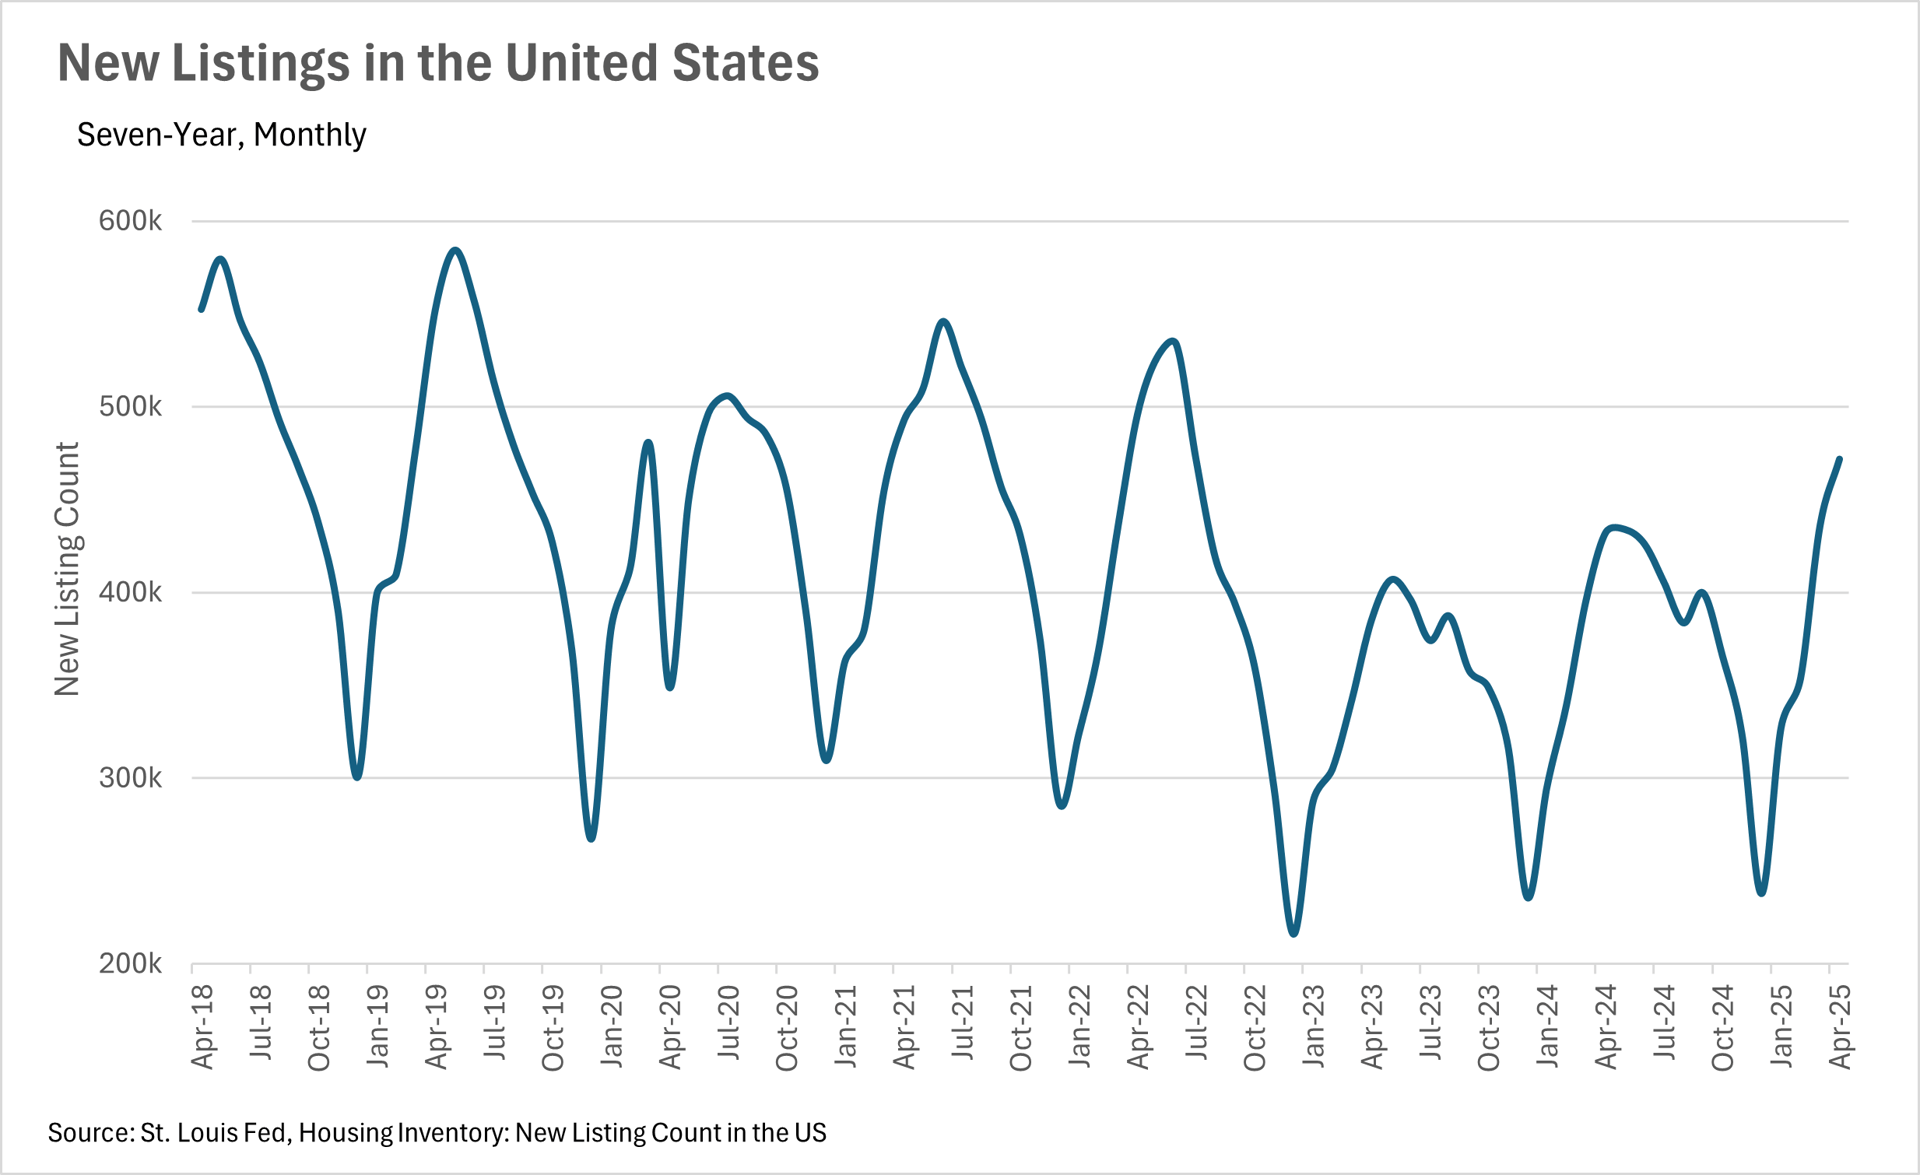
As you might have expected, there was a considerable increase in the number of listings that have hit the market too. For a few months in a row we have seen high single/low double-digit percentage growths in the number of new listings hitting the market in the US. This is likely due to the fact that the people who were holding out for the return of lower interest rates are losing hope and listing their homes anyway.
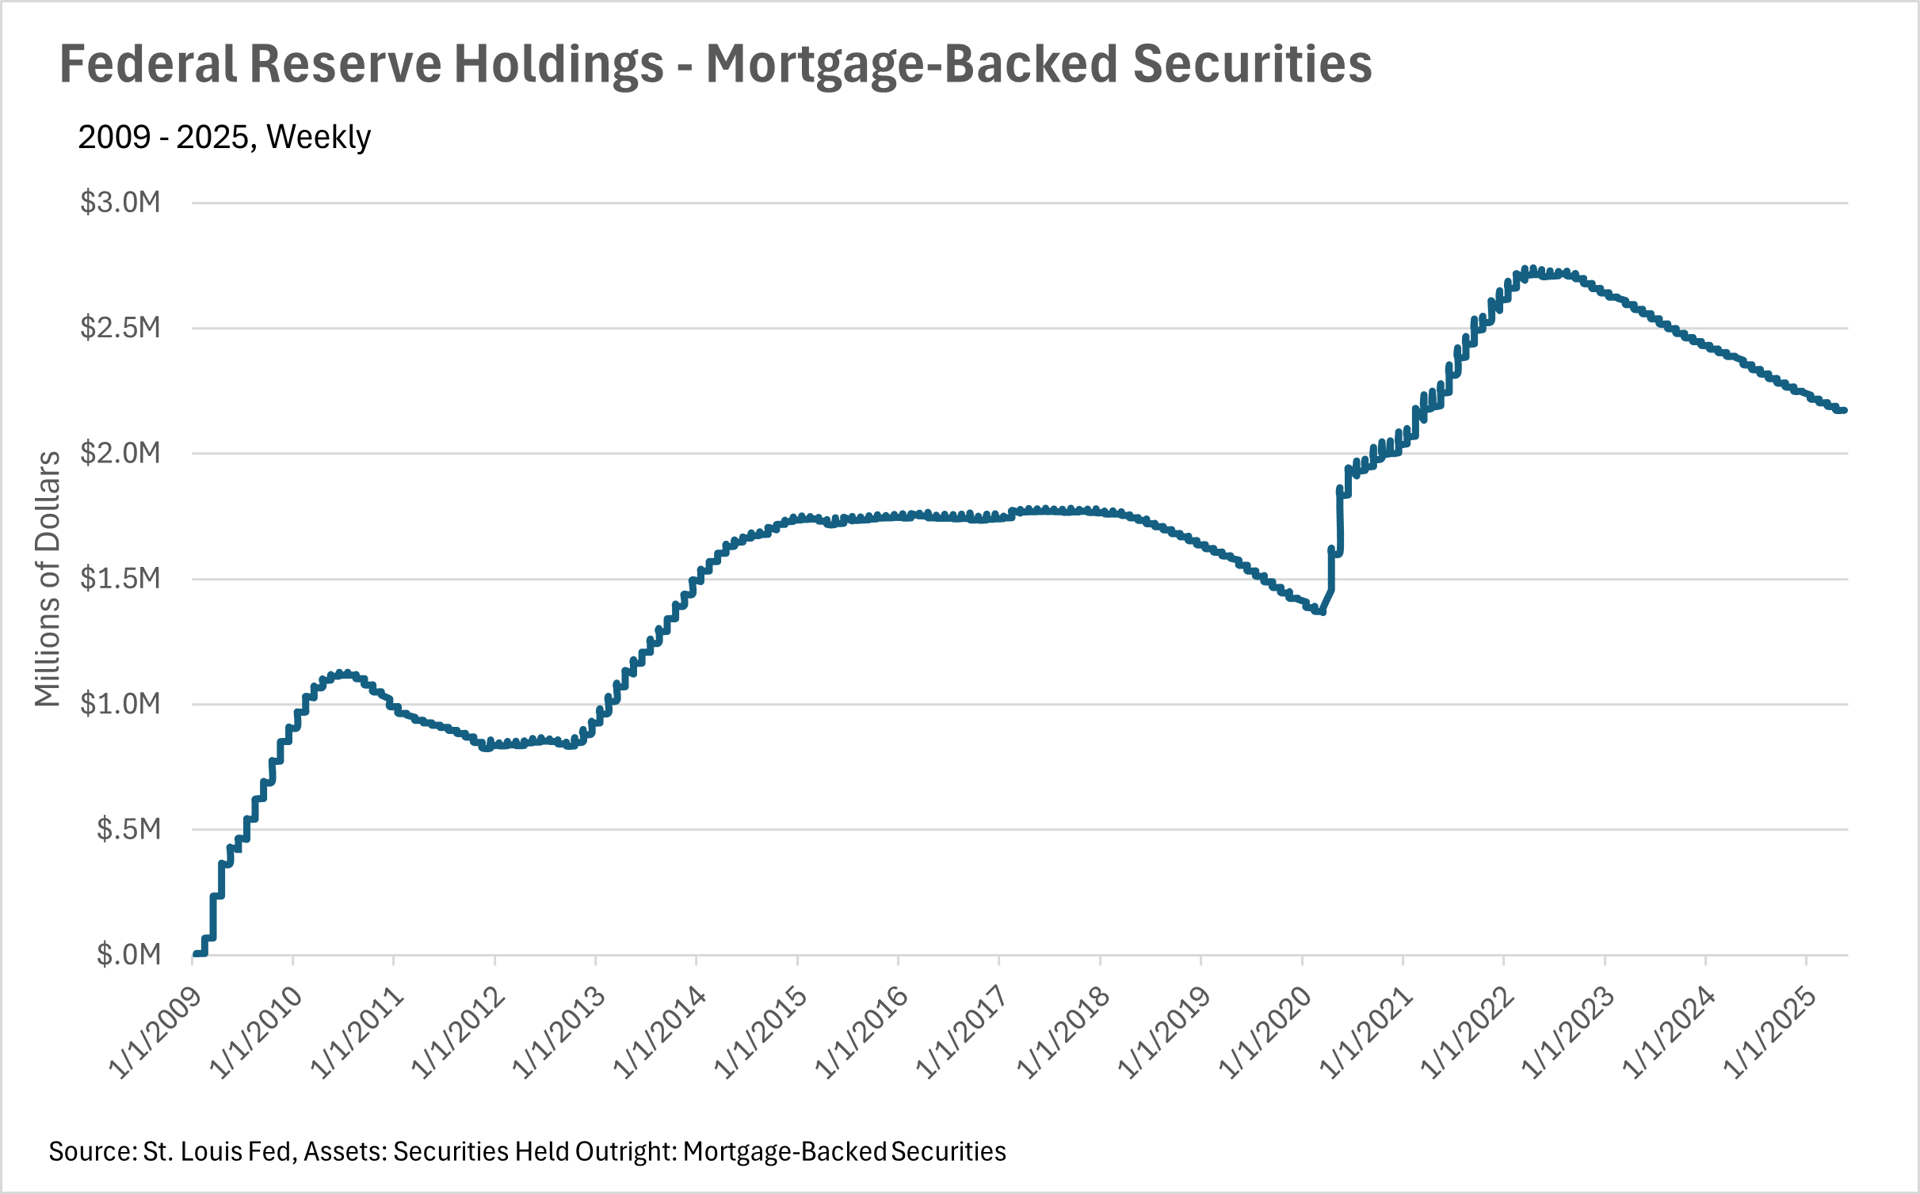
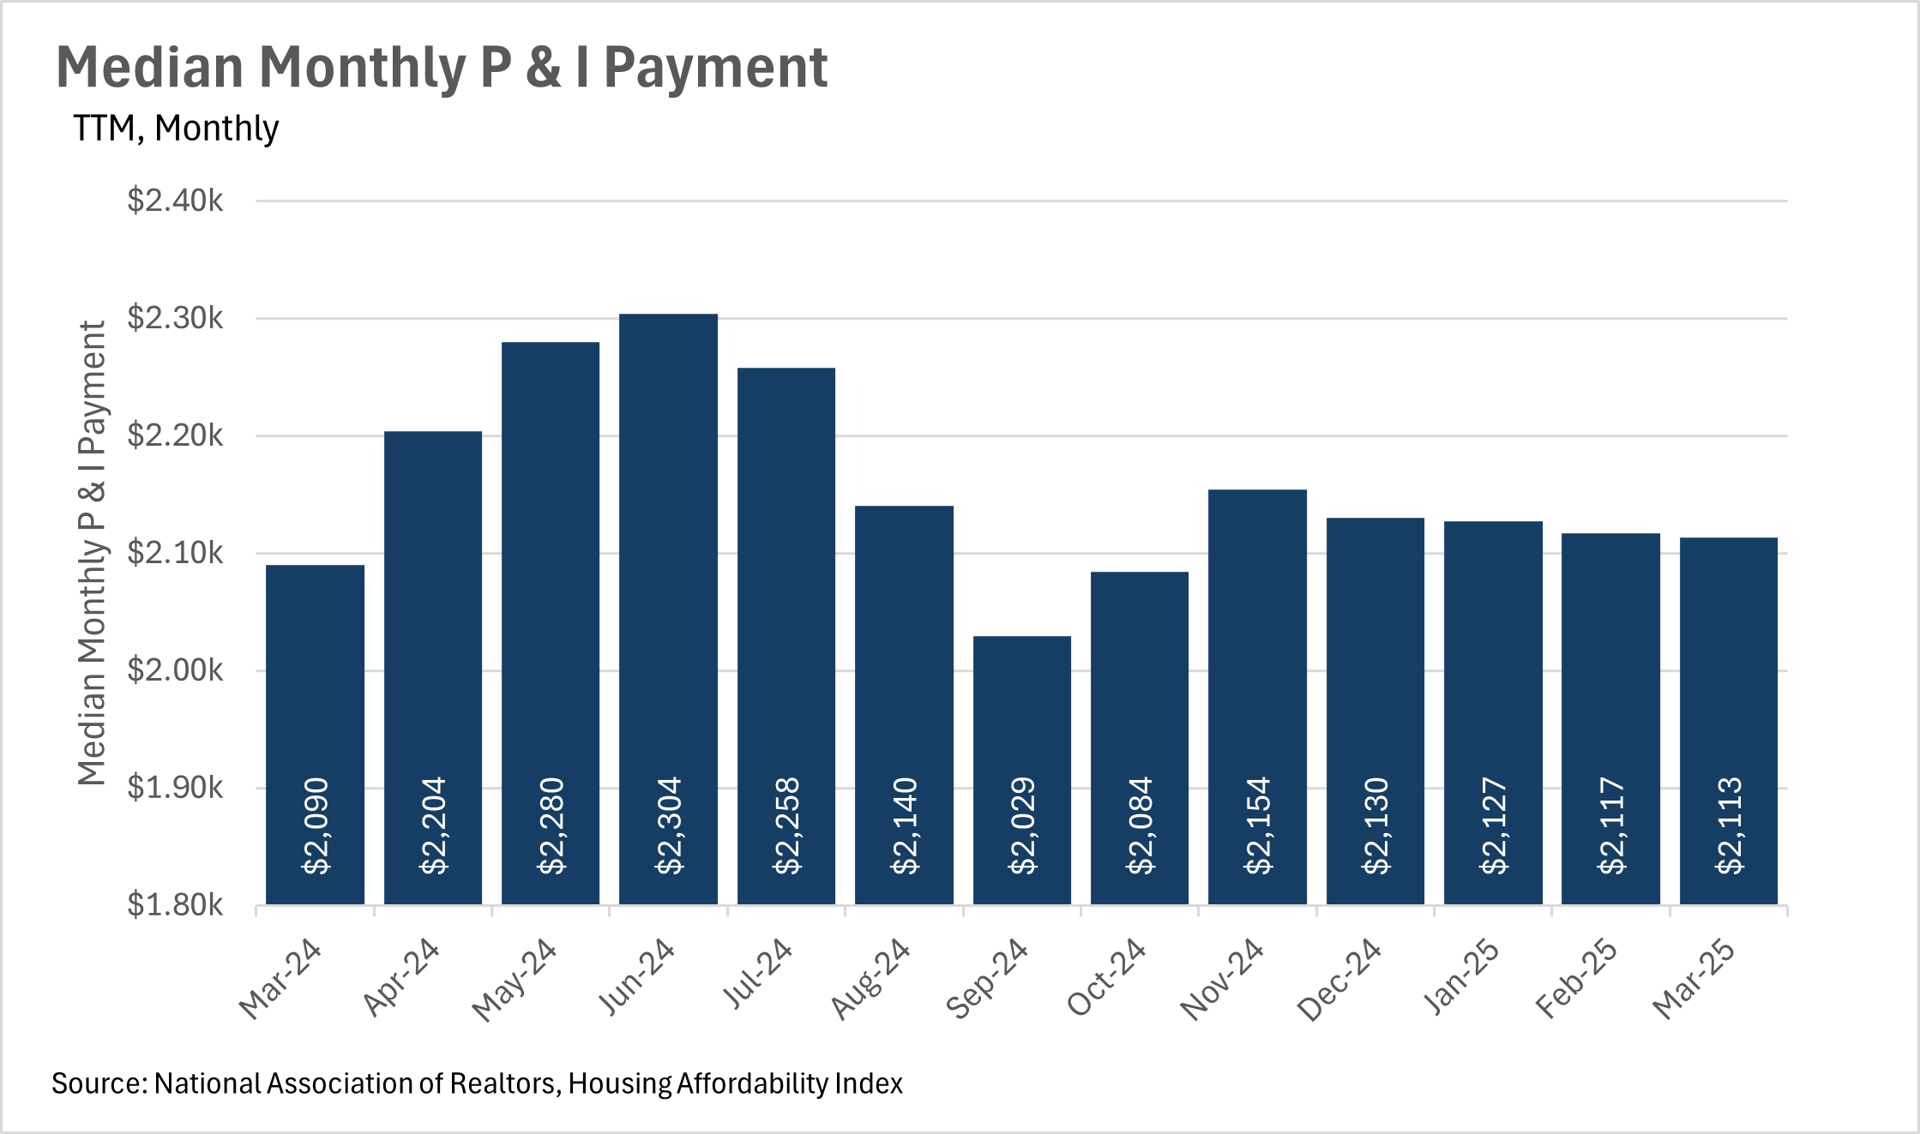
On the bright side, mortgage rates have continued their slow descent, with the average interest rate on a 30-year mortgage in March coming in at around 6.63%, down roughly a quarter point from the year prior. As you might expect, the median monthly P&I payment ticked down slightly, and the median sale price ticked up slightly to match this move. Although mortgage rates have come down a bit, it’s important to remember that the biggest drivers behind mortgage rates are, of course, the 10-year treasury and the federal funds rate. In the most recent Federal Open Market Committee meeting, the Fed has decided to keep the federal funds rate in line with where it’s been over the past few months, despite many Americans feeling the effects of the trade war on their wallets.
As we have discussed in prior months, the Fed is in no rush to lower interest rates anytime soon. However, they do see a not-so-distant future where rates are a good bit lower. When you combine this with the fact that inventories are building at a rapid rate, and the number of units being sold has fallen slightly, this could represent a fantastic buying opportunity! Ultimately though, this is just what we’re seeing at a national level. As we all know, real estate is an incredibly localized industry, so knowing what’s going on in your own market is pivotal. Below is our local lowdown, that outlines everything you need to know about what’s happening around you in your neighborhood and surrounding areas!
THE LOCAL LOWDOWN
-
Bay Area real estate markets show mixed trends in April, with some areas seeing price declines while others maintain growth.
-
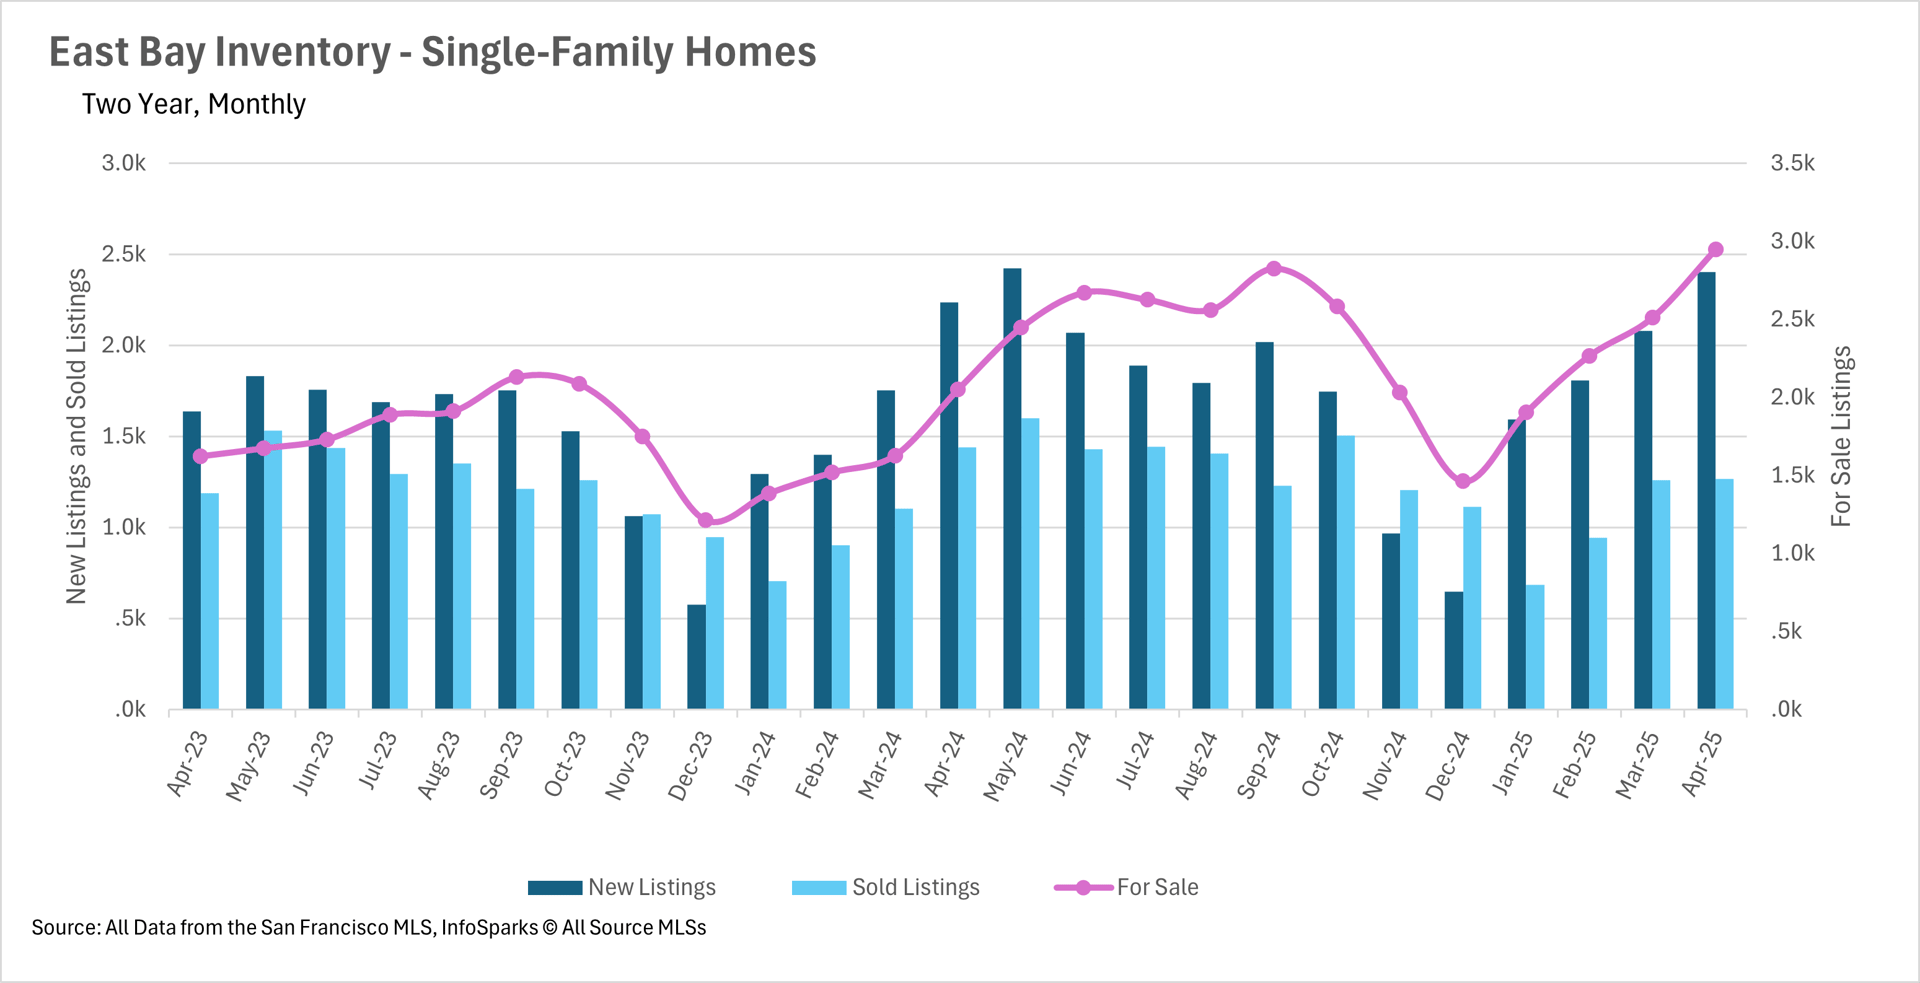
Inventory dynamics vary dramatically by region, with East Bay seeing substantial increases (~43%) while San Francisco continues to struggle with persistent shortages.
-
The single-family home market remains largely a seller's market across most Bay Area regions, while the condo market generally favors buyers with higher months of supply.
-
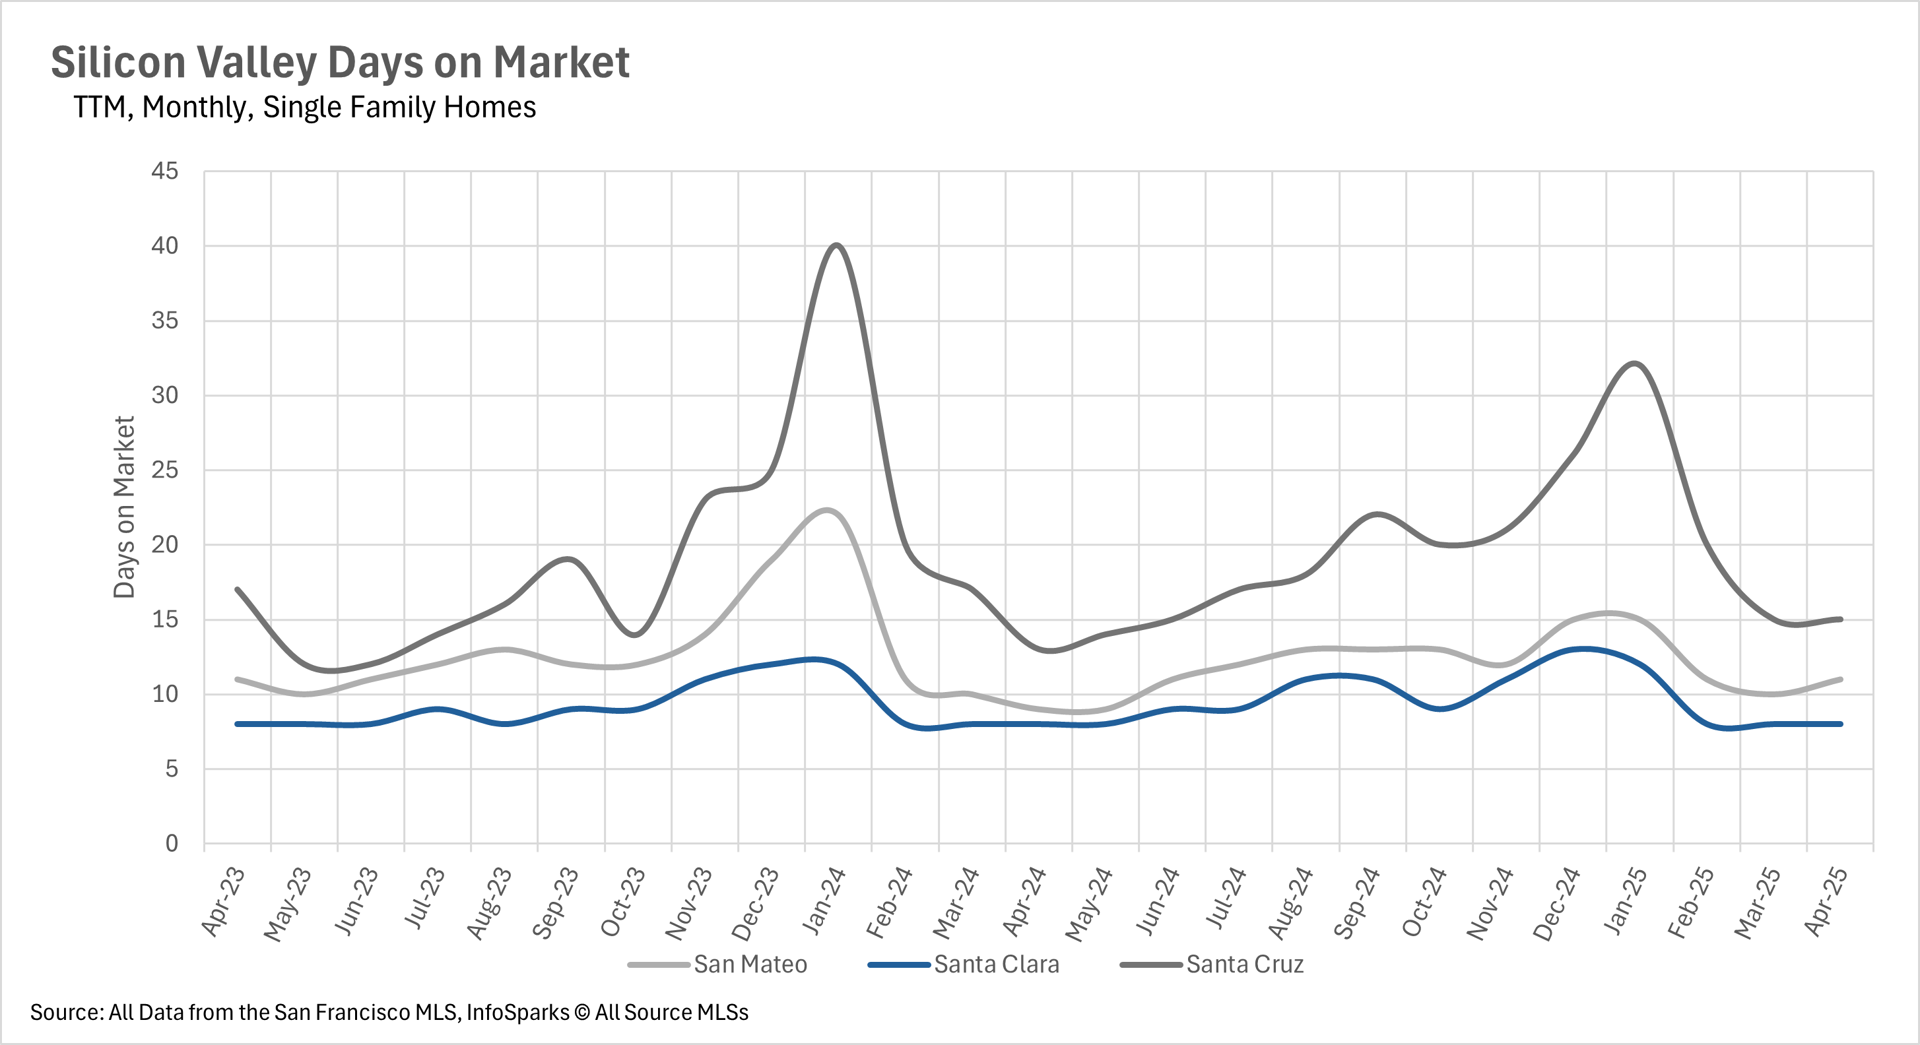
Despite varying inventory levels, homes are still selling relatively quickly throughout the Bay Area, with particularly fast movement in Silicon Valley (8-15 days).
PRICES TENDS VARY SIGNIFICANTLY ACROSS BAY AREA REGIONS
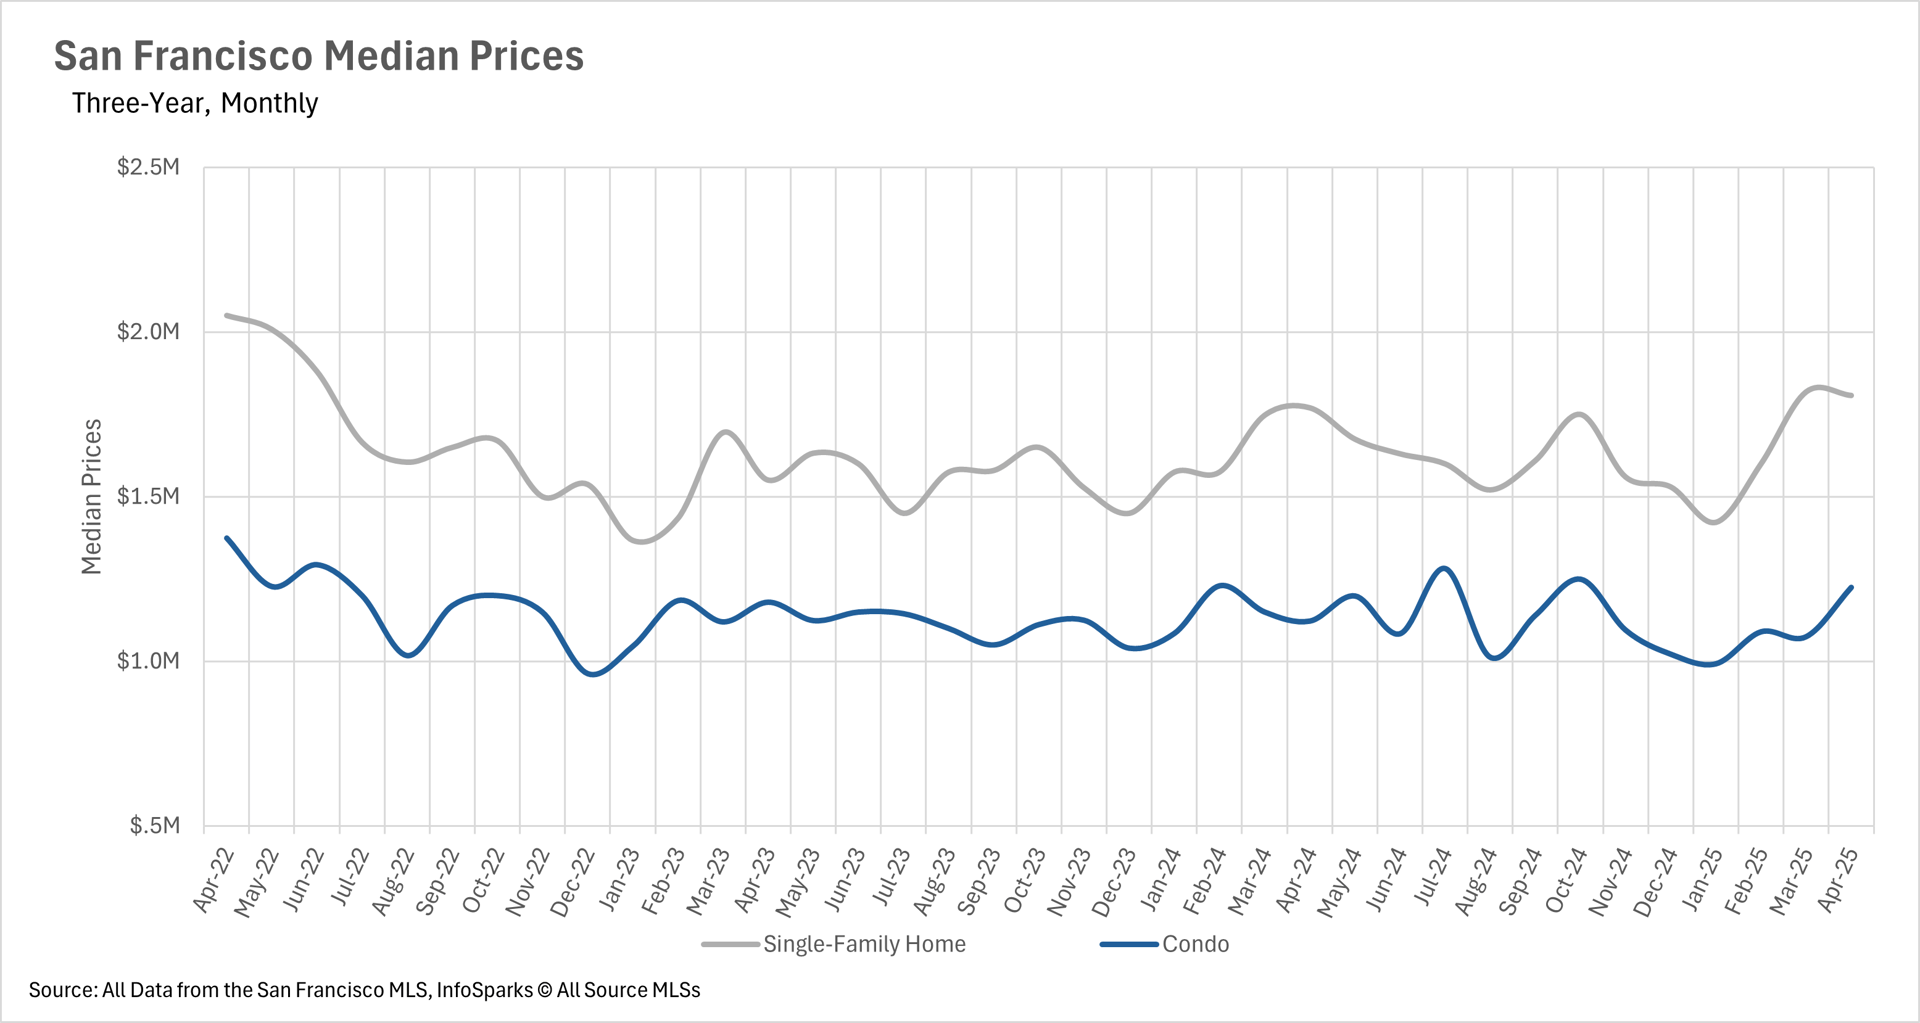
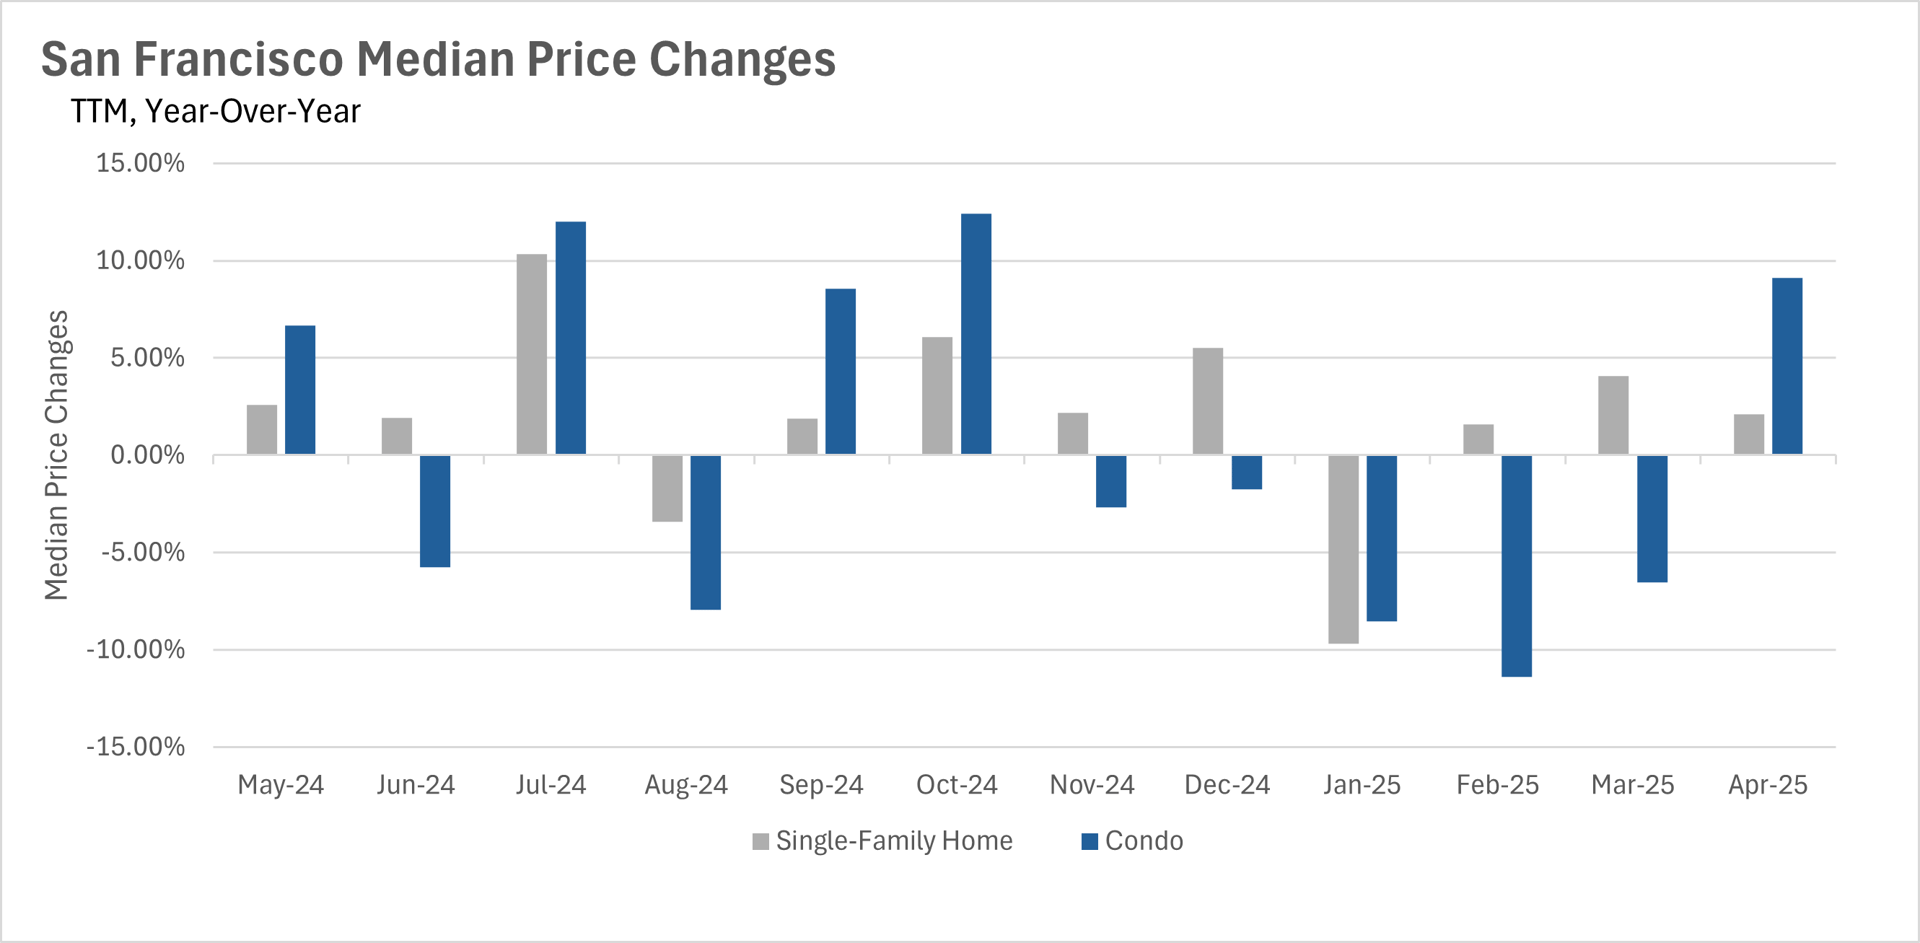
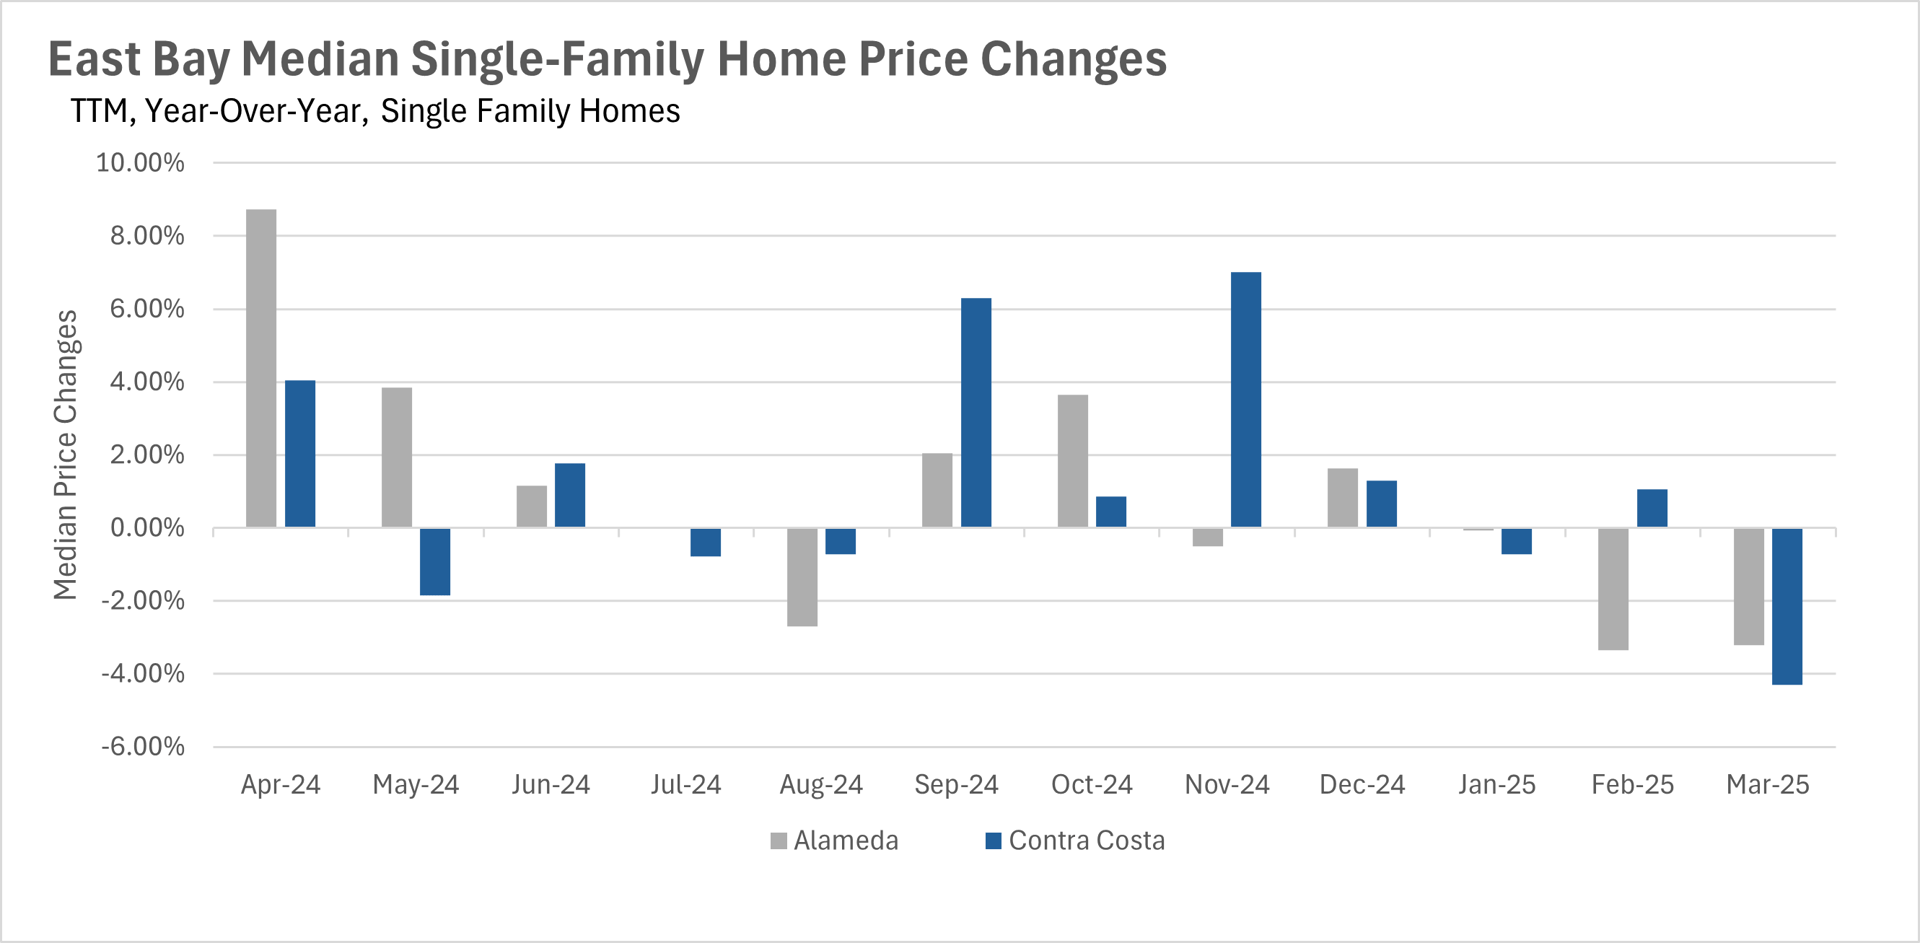
April showed considerable variation in price trends across the Bay Area. Silicon Valley presented a mixed picture, with Santa Cruz County breaking its year-long winning streak as median sale prices fell 8.57% year-over-year, while San Mateo and Santa Clara Counties continued positive growth at 1.69% and 5.50% respectively.
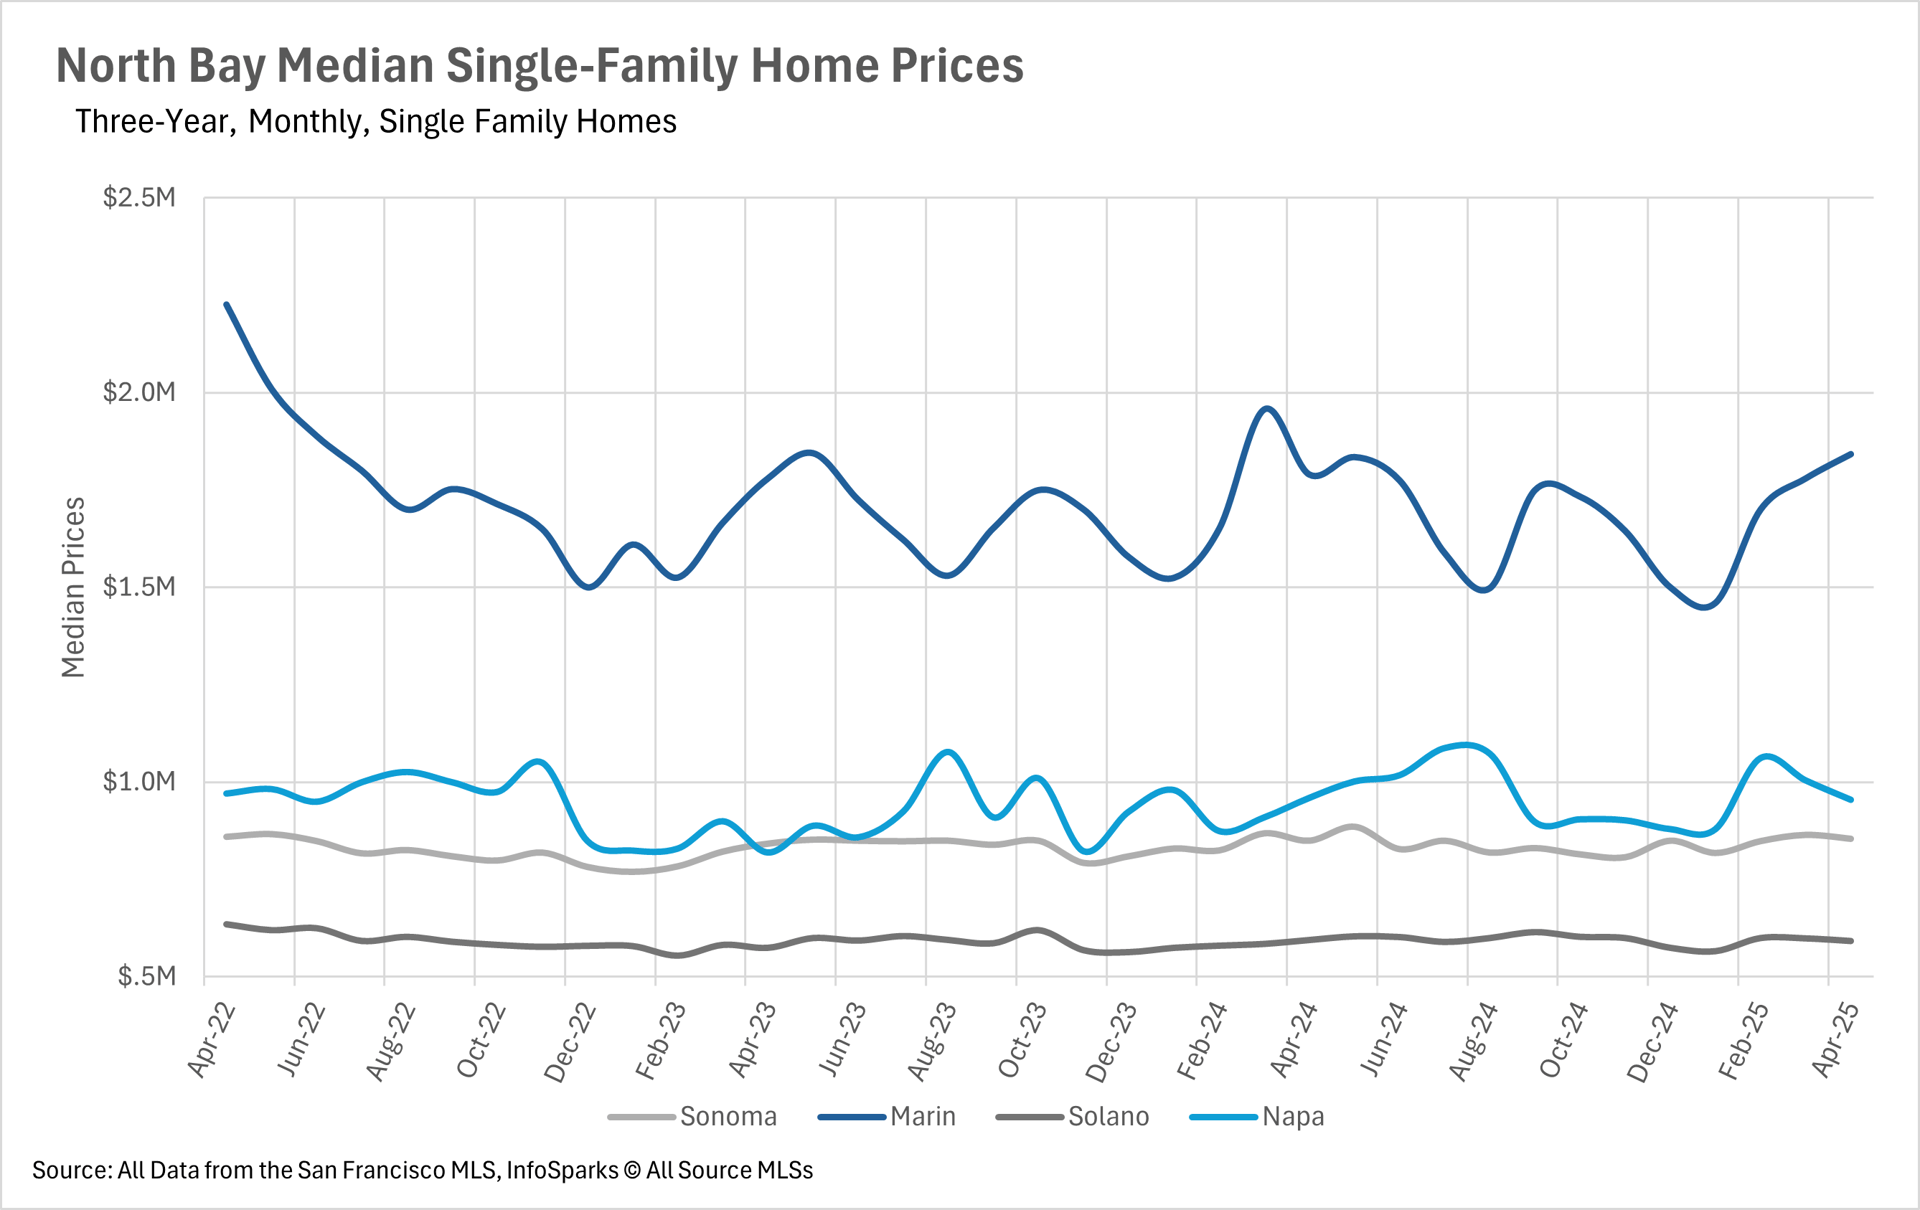
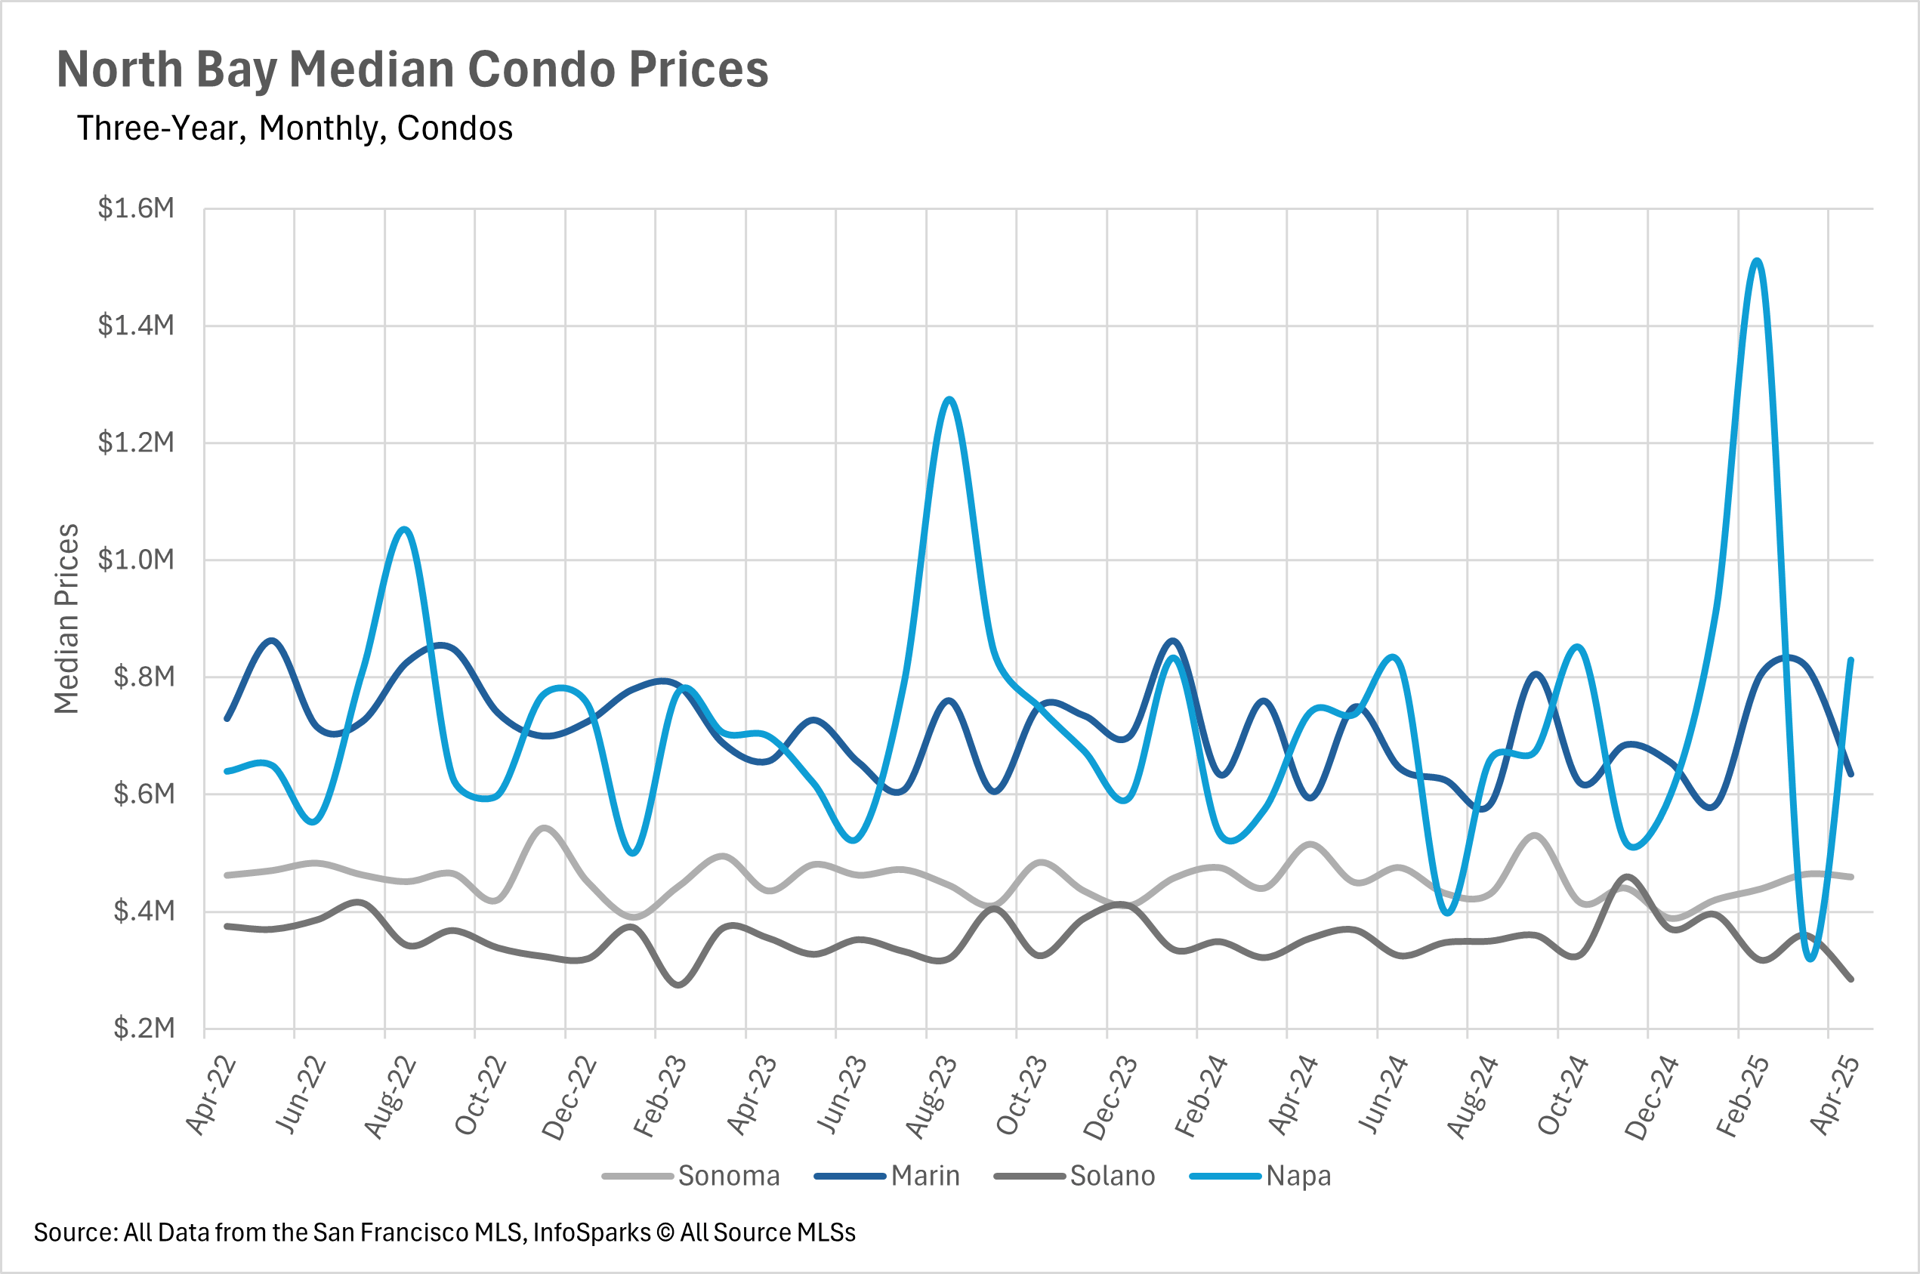
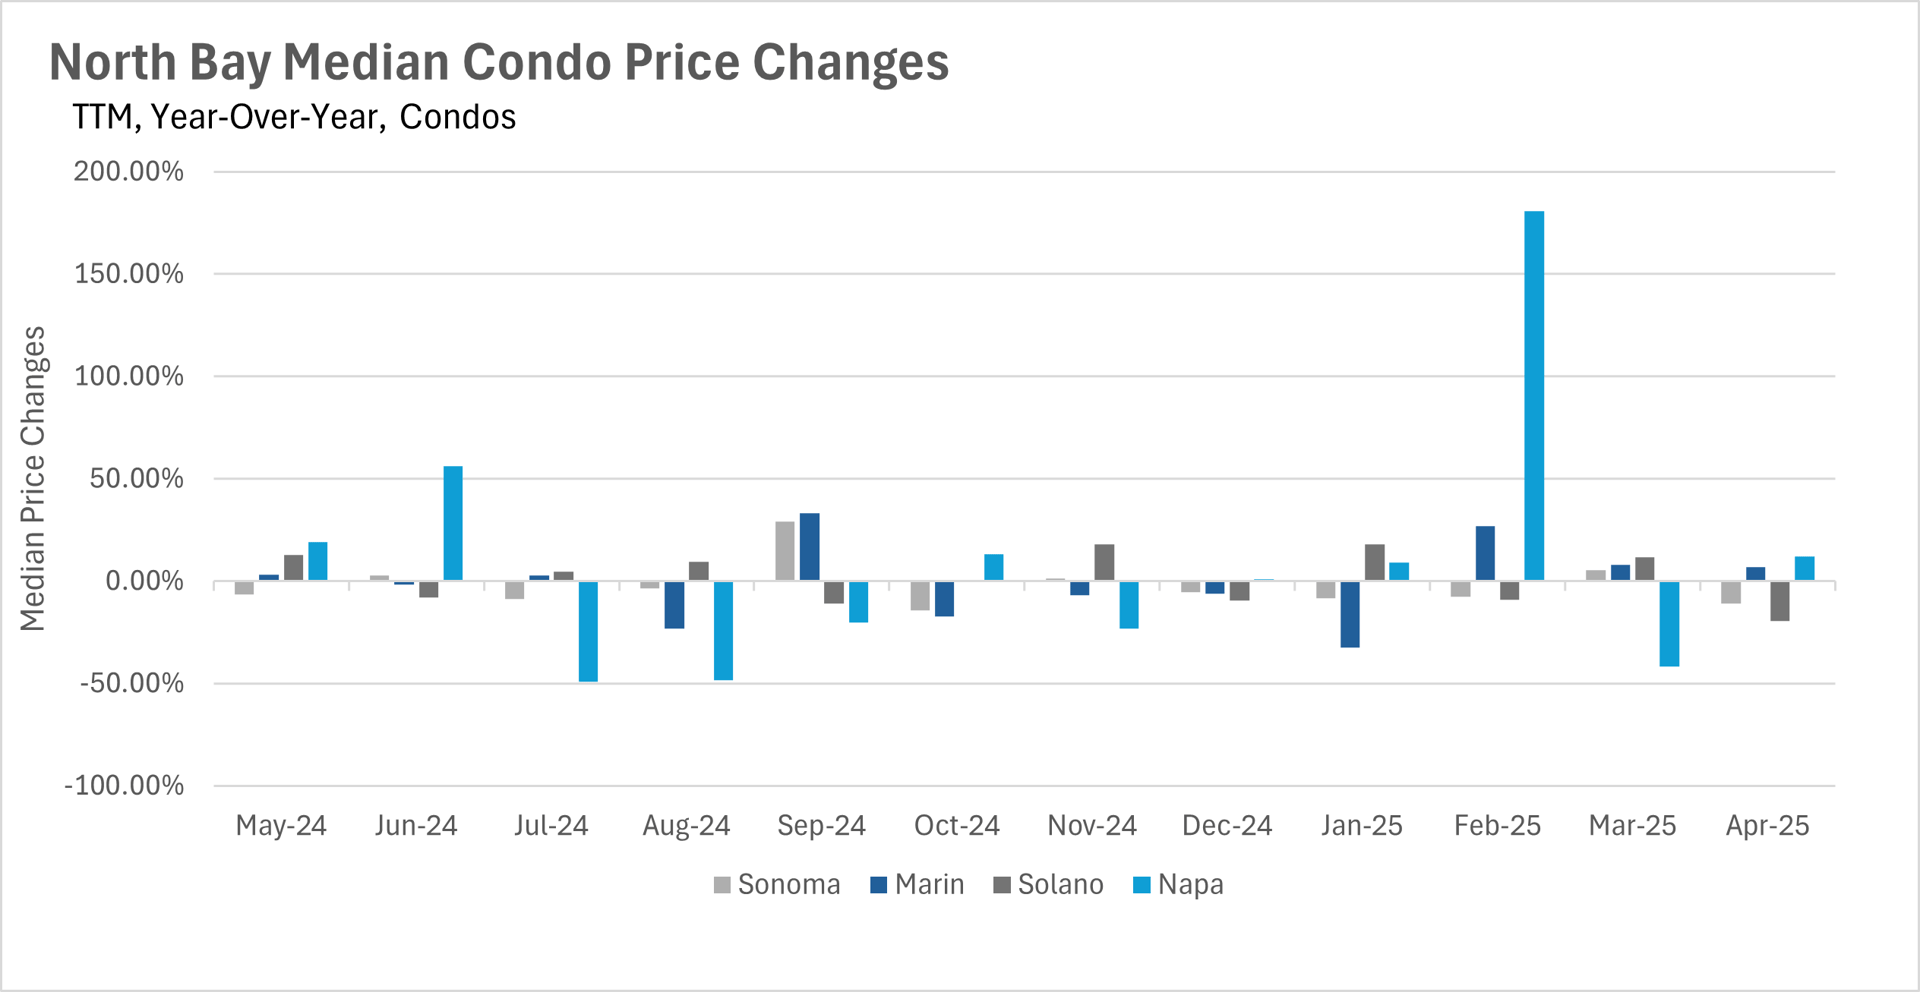
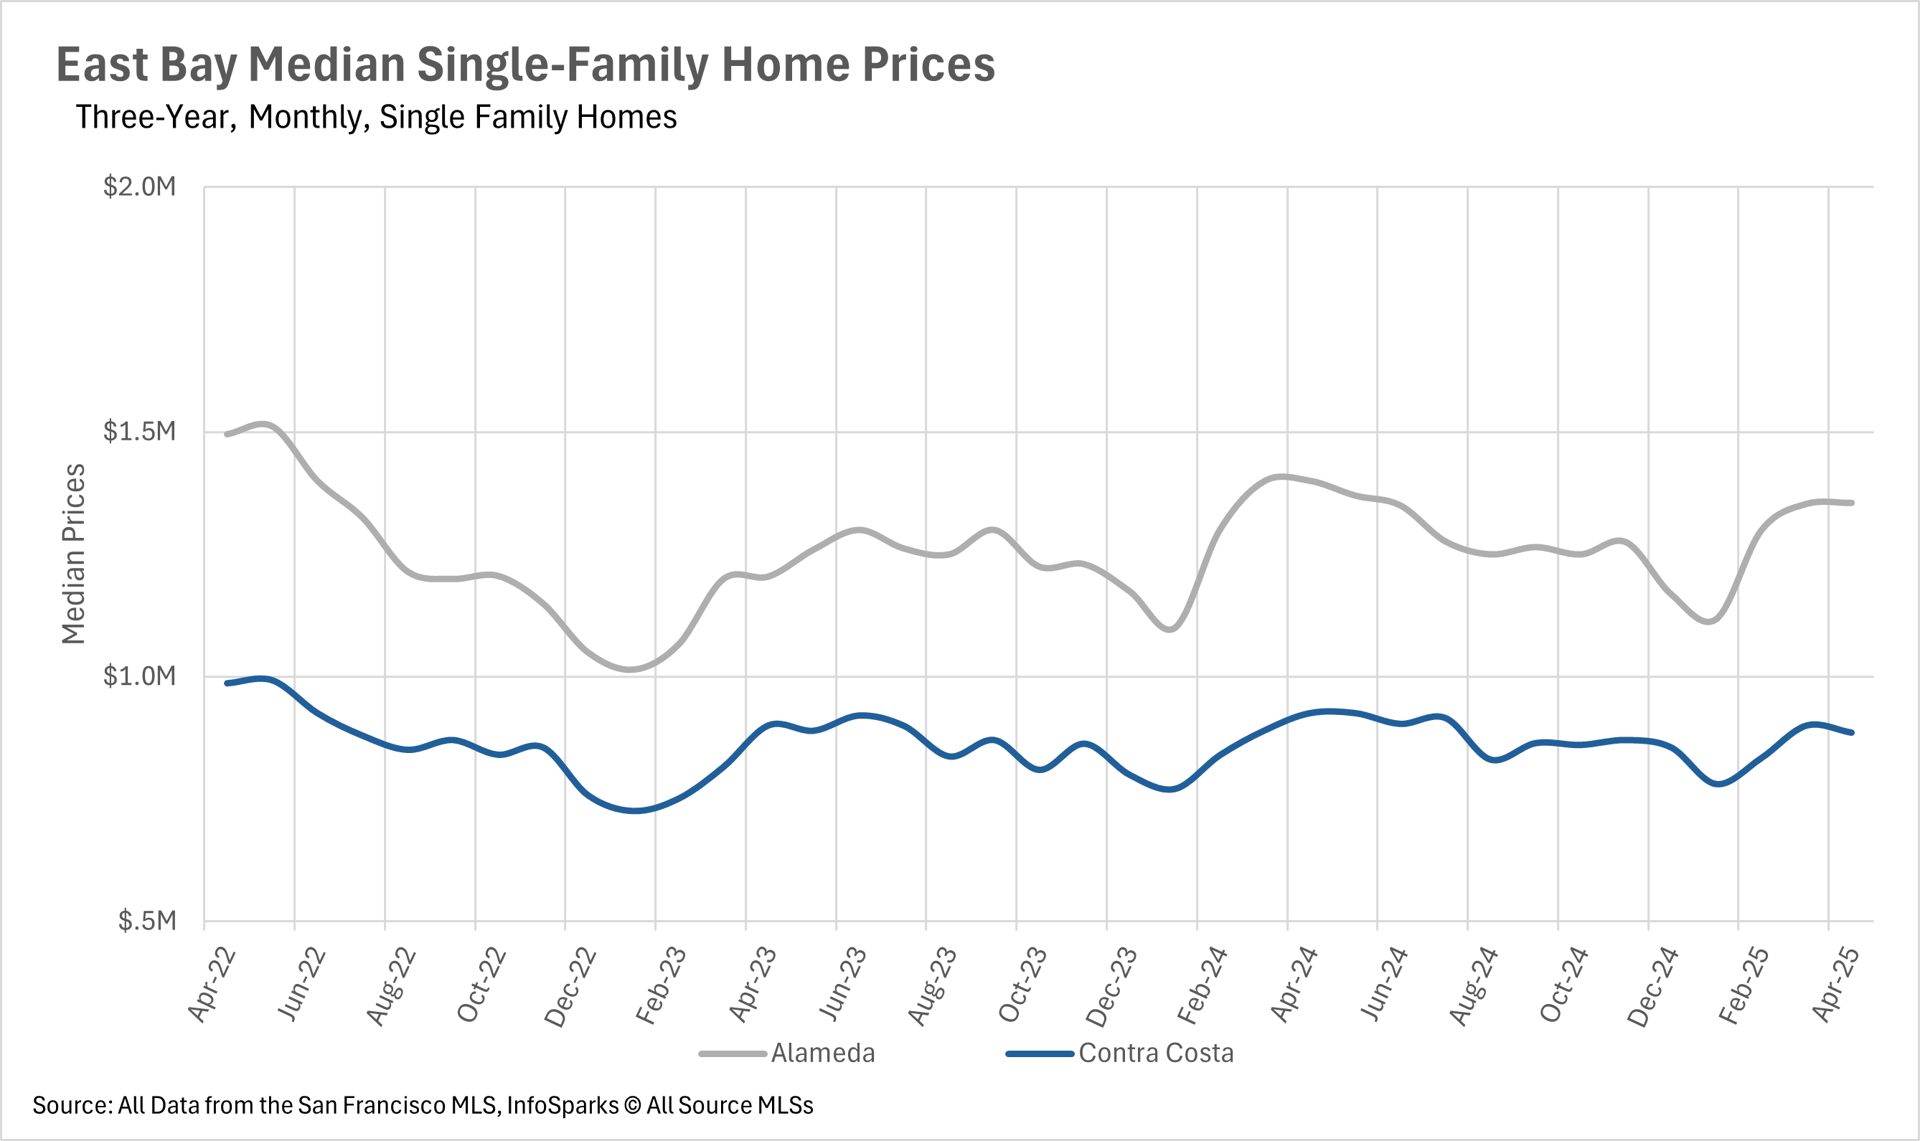
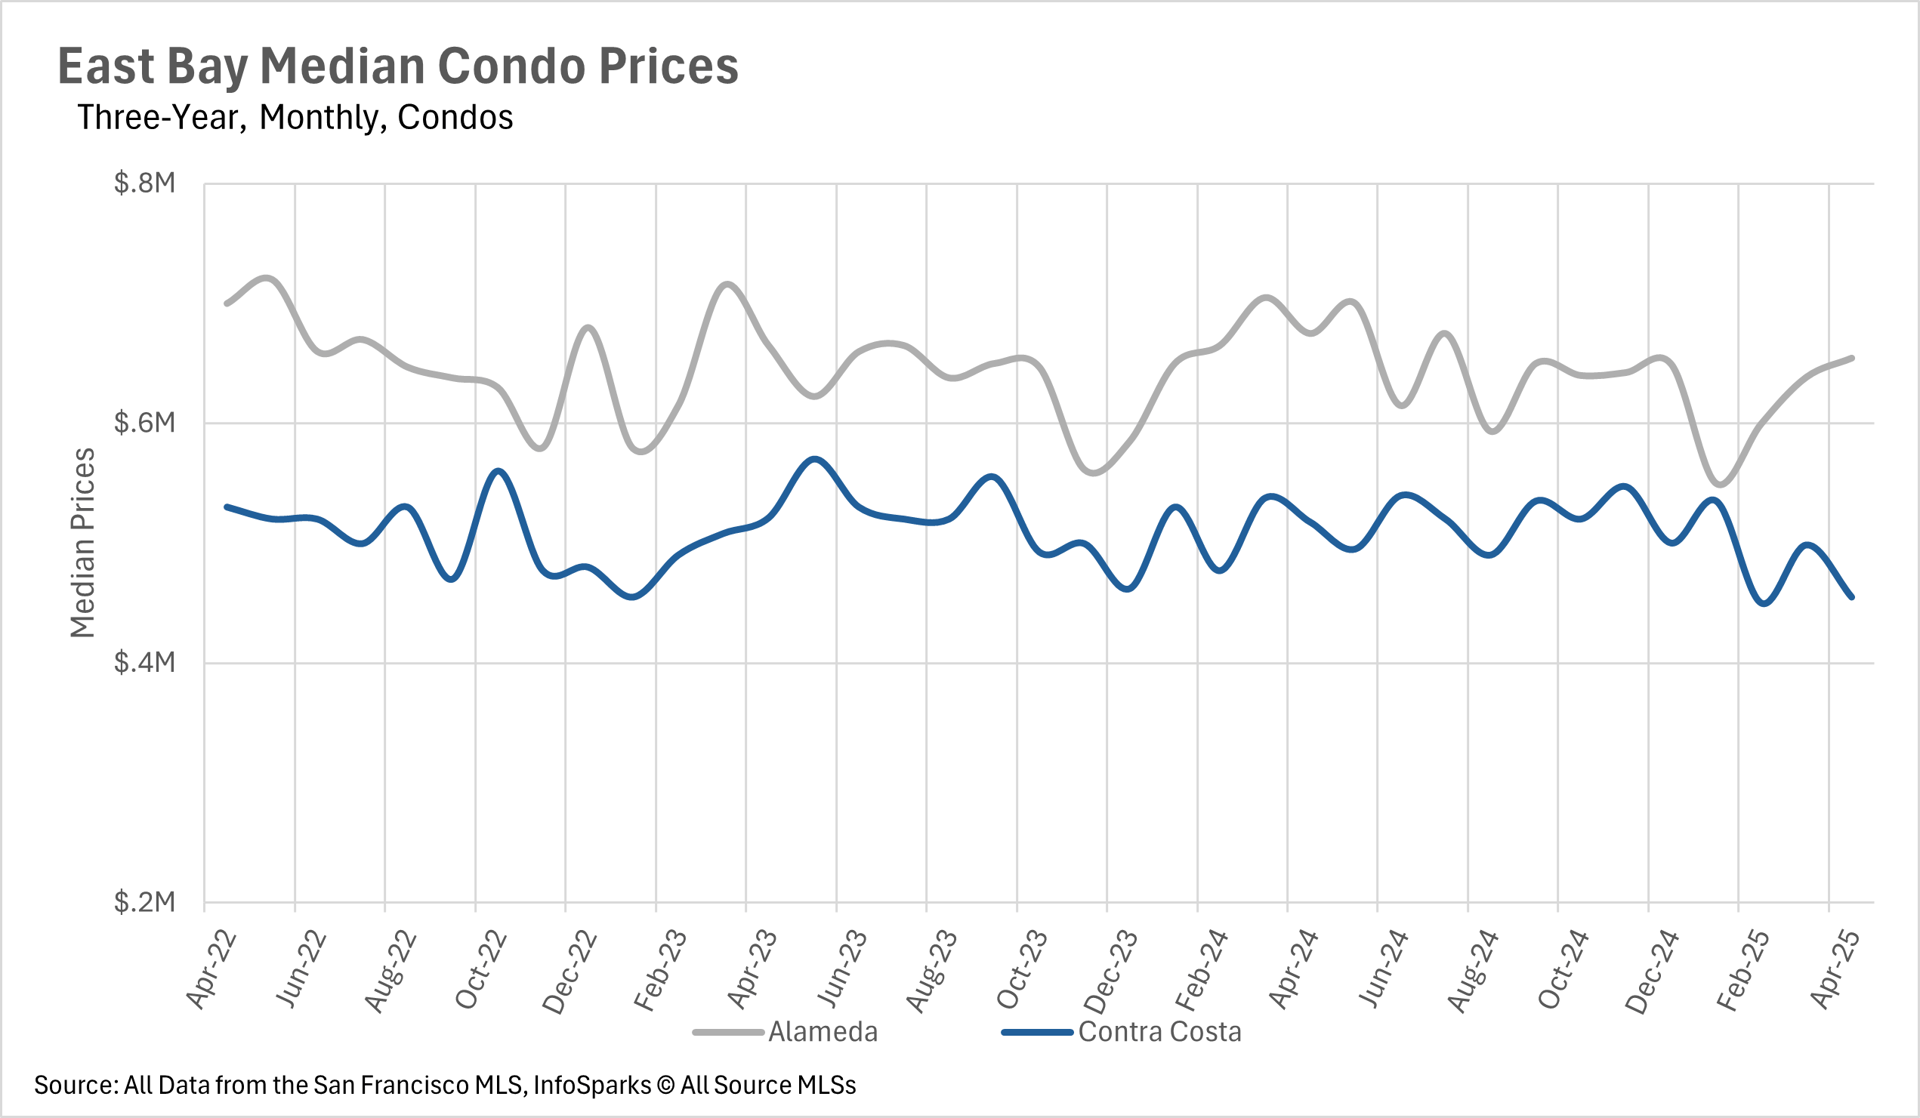
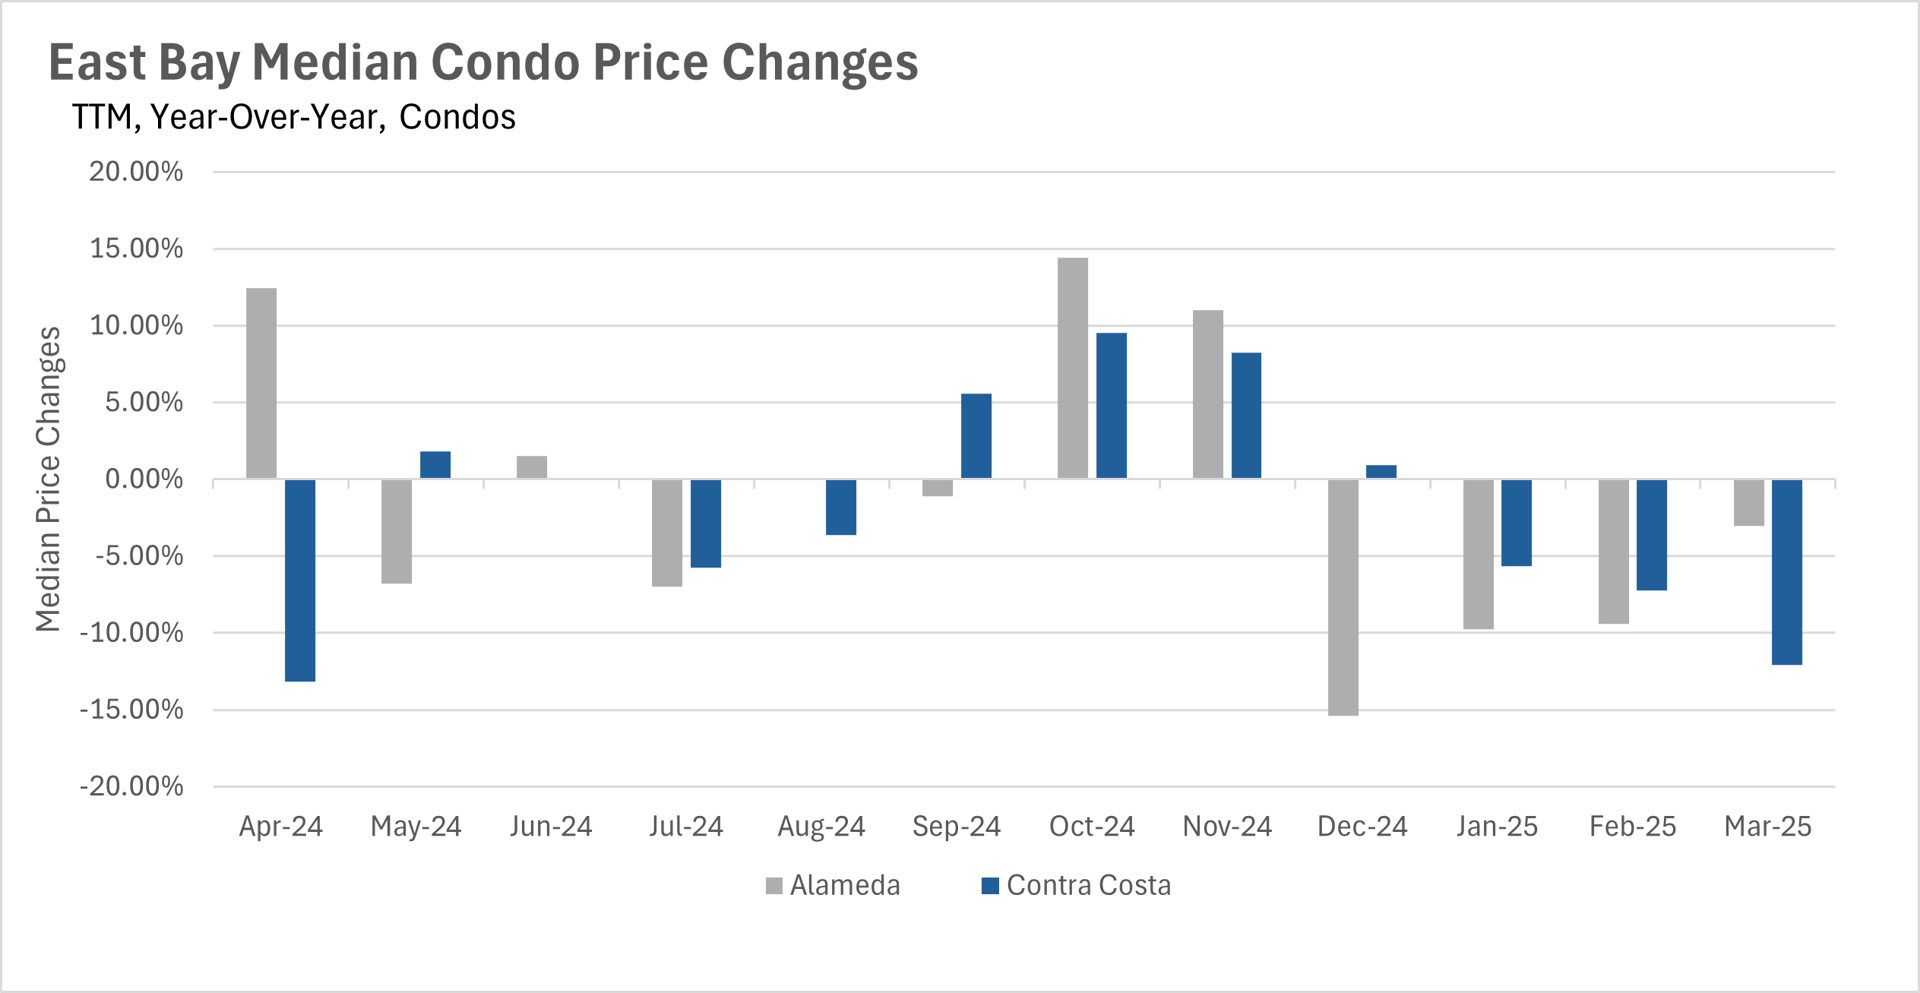
The East Bay saw widespread price declines, with single-family homes in Alameda and Contra Costa Counties dropping 3.21% and 4.31%, and Contra Costa condos experiencing a sharp 12% decrease. North Bay prices remained relatively flat, with minimal movement in Sonoma, Marin, Solano, and Napa Counties (ranging from +2.93% to -0.52%). San Francisco showed contrasting trends, with single-family home prices increasing modestly by 2.12%, while condo prices reversed their five-month decline with a robust 9.13% increase, possibly signaling a turning point for the San Francisco condo market.
1.Inventory Trends: Big Swings by Region
Inventory levels across the Bay Area show major regional differences:
-
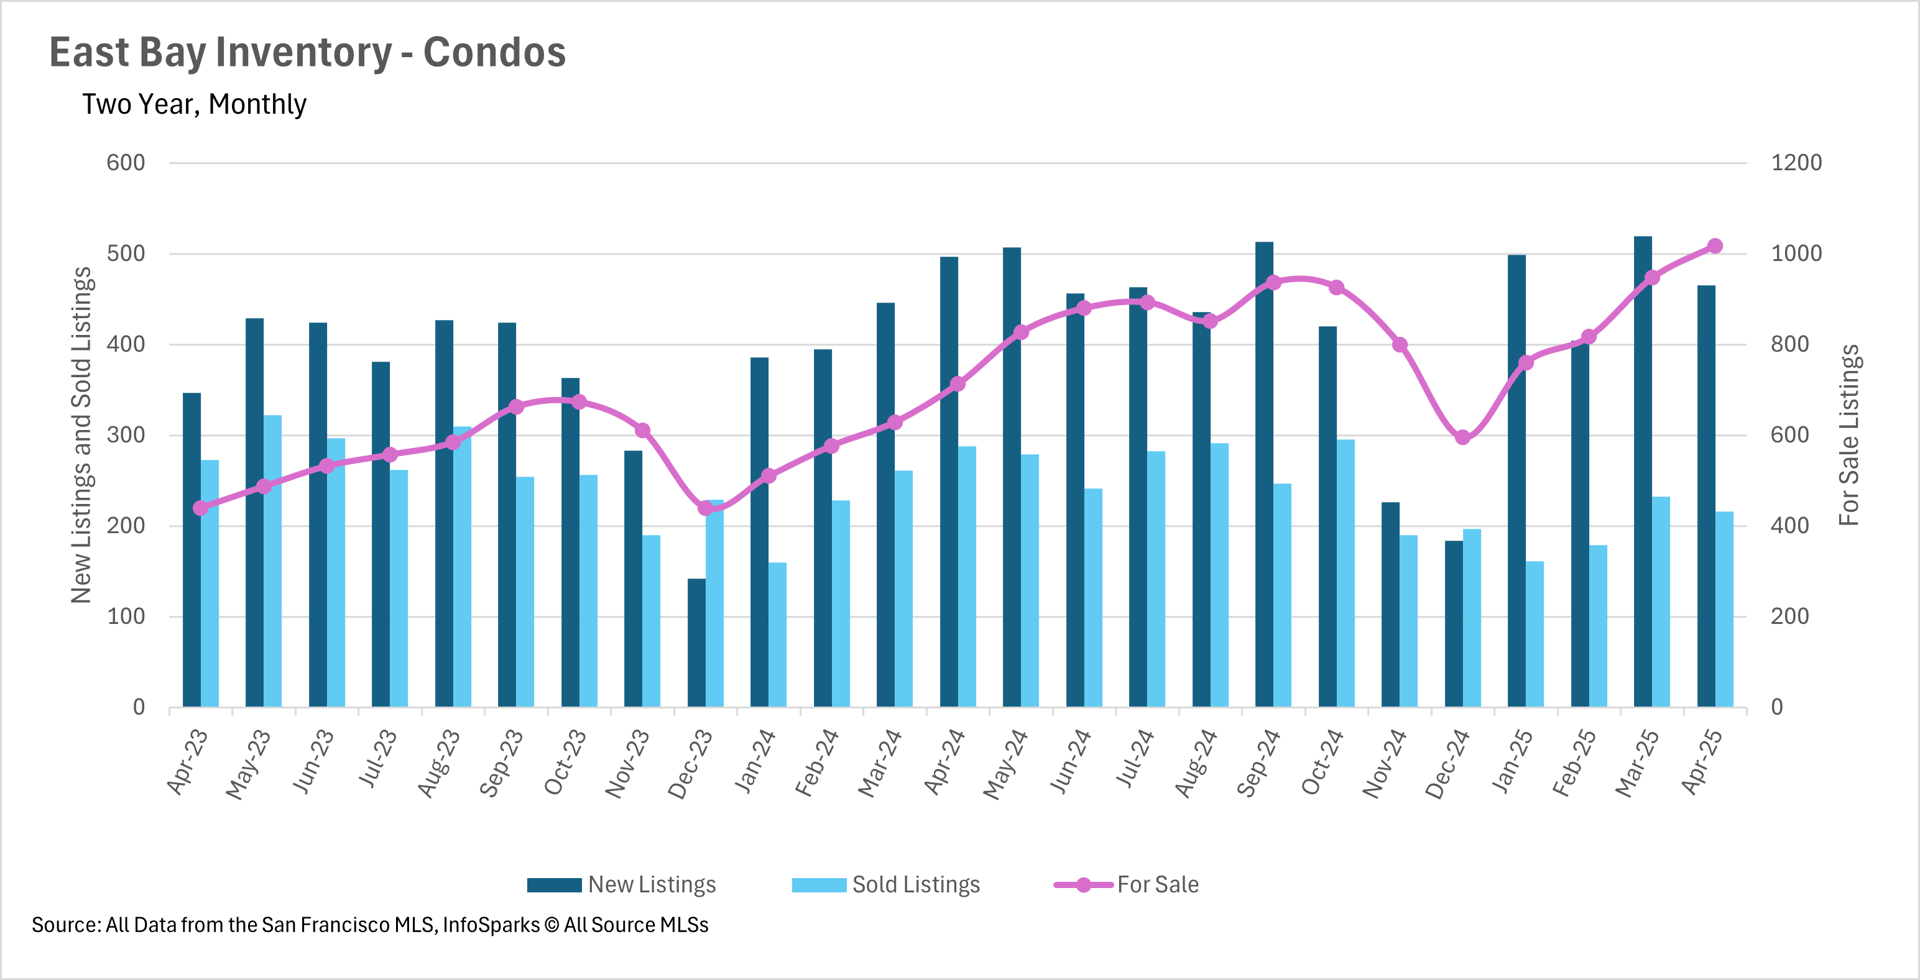
East Bay saw the largest increase — up 43% for both single-family homes and condos year-over-year, as new listings rose and sales slowed.
-
Silicon Valley followed with inventory up nearly 30% for single-family homes and 51% for condos.
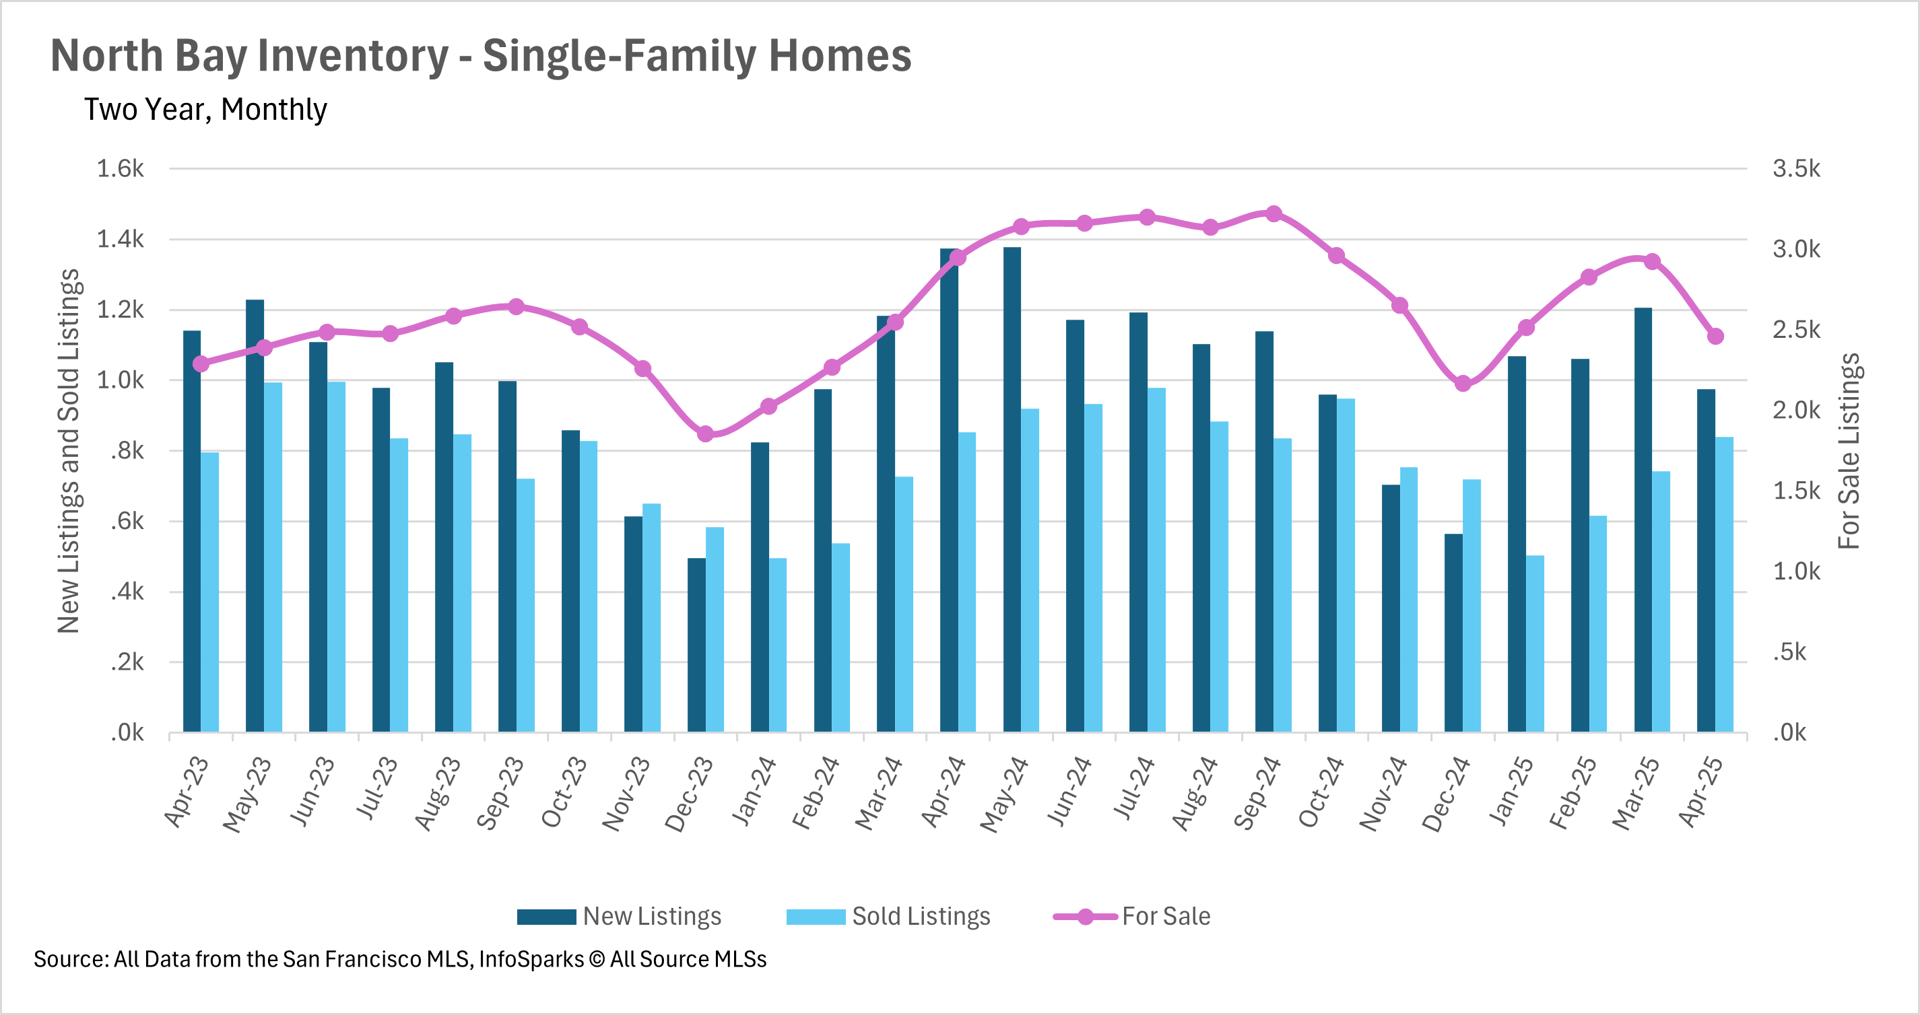
-
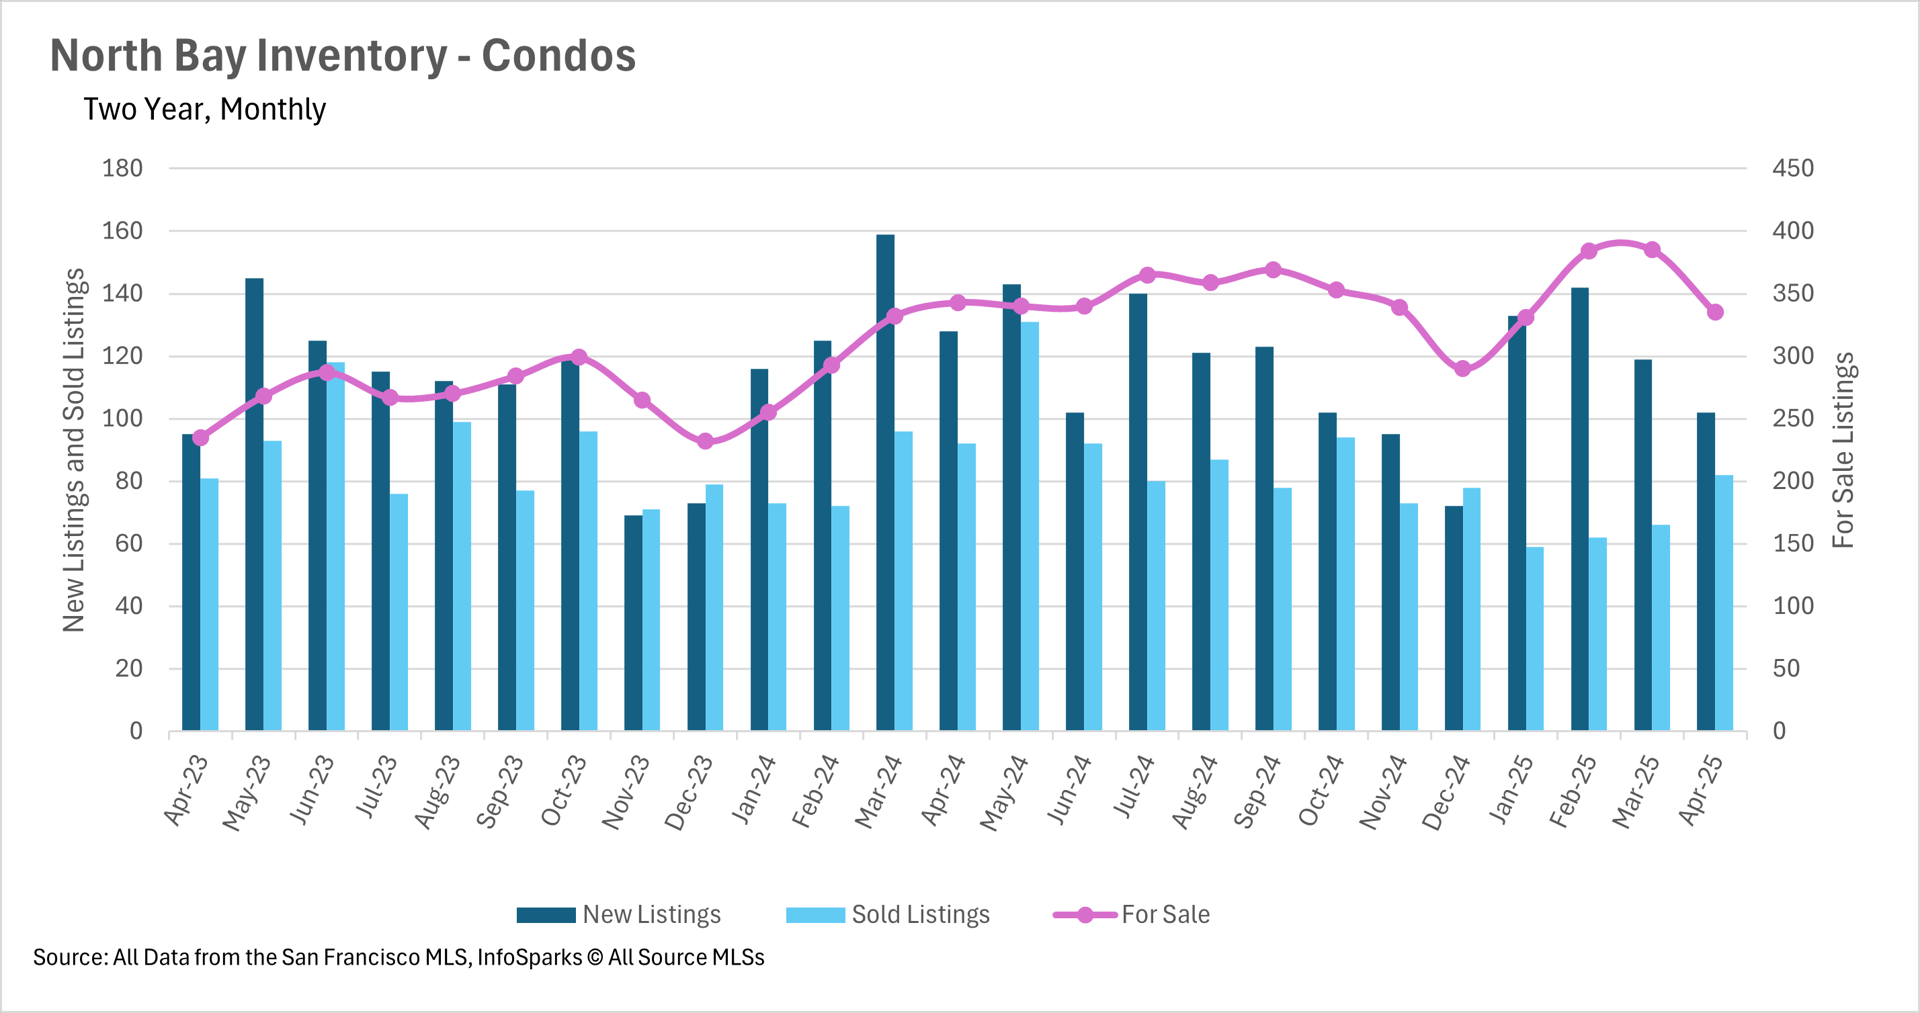
North Bay, in contrast, experienced a decline in inventory, driven by 30% fewer new listings than last year.
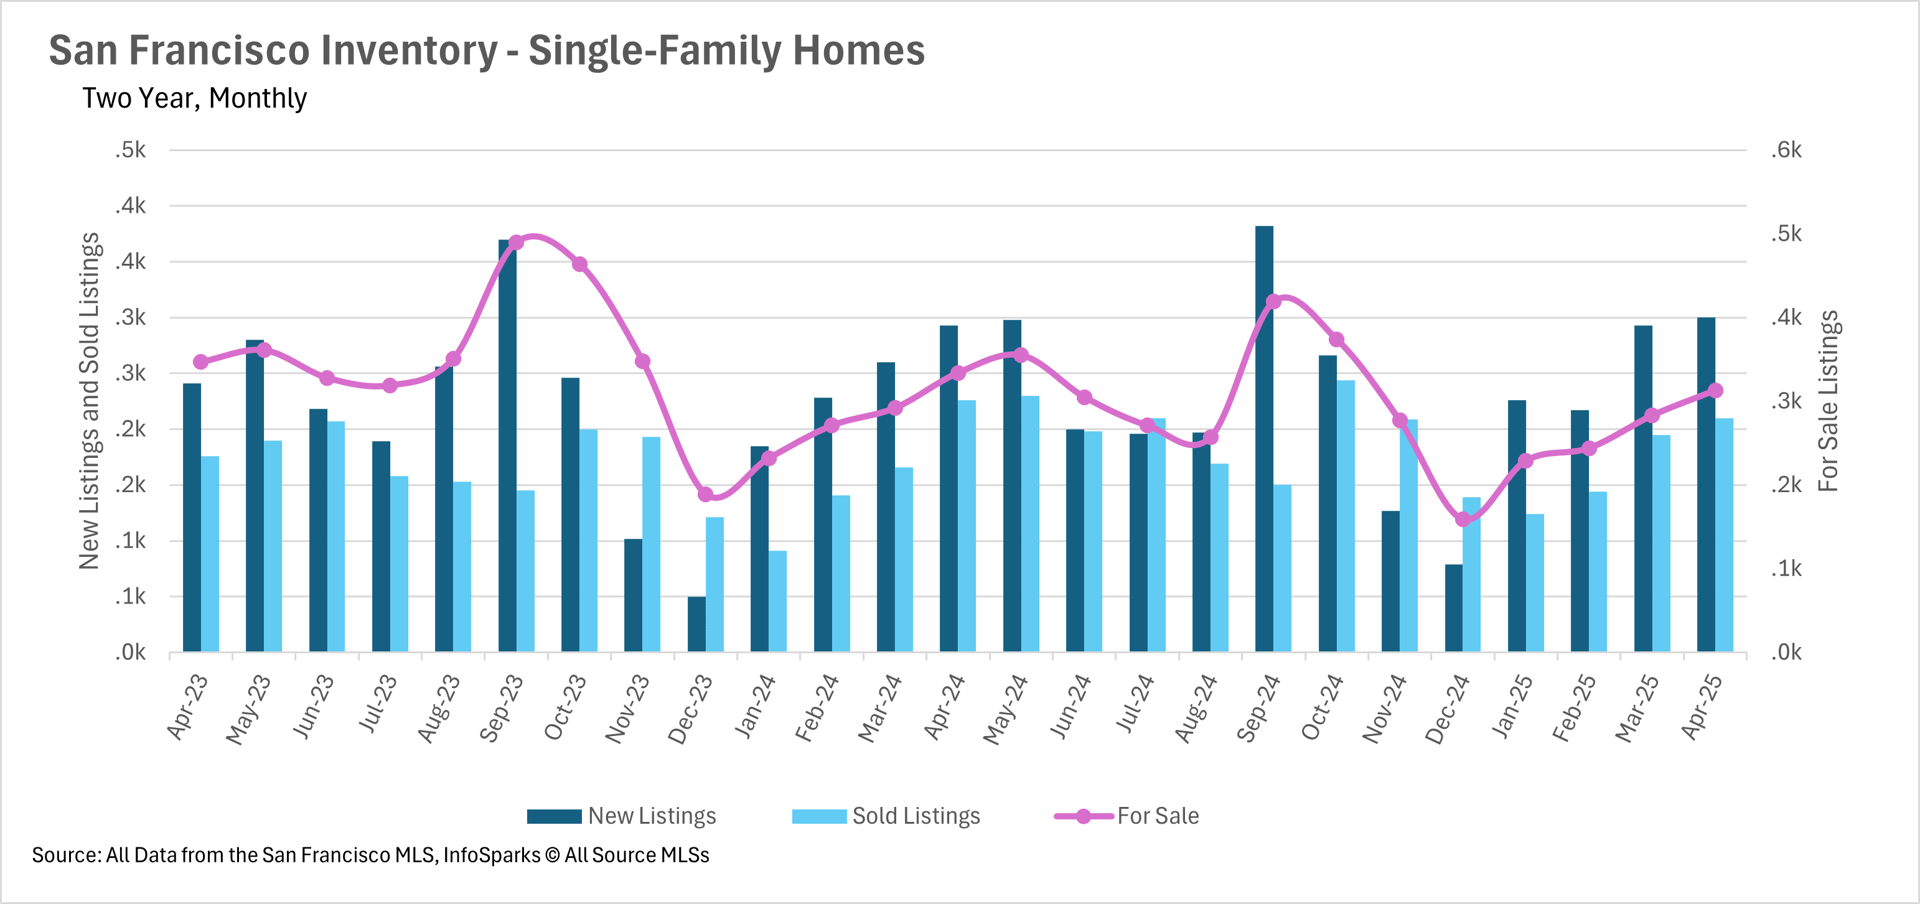
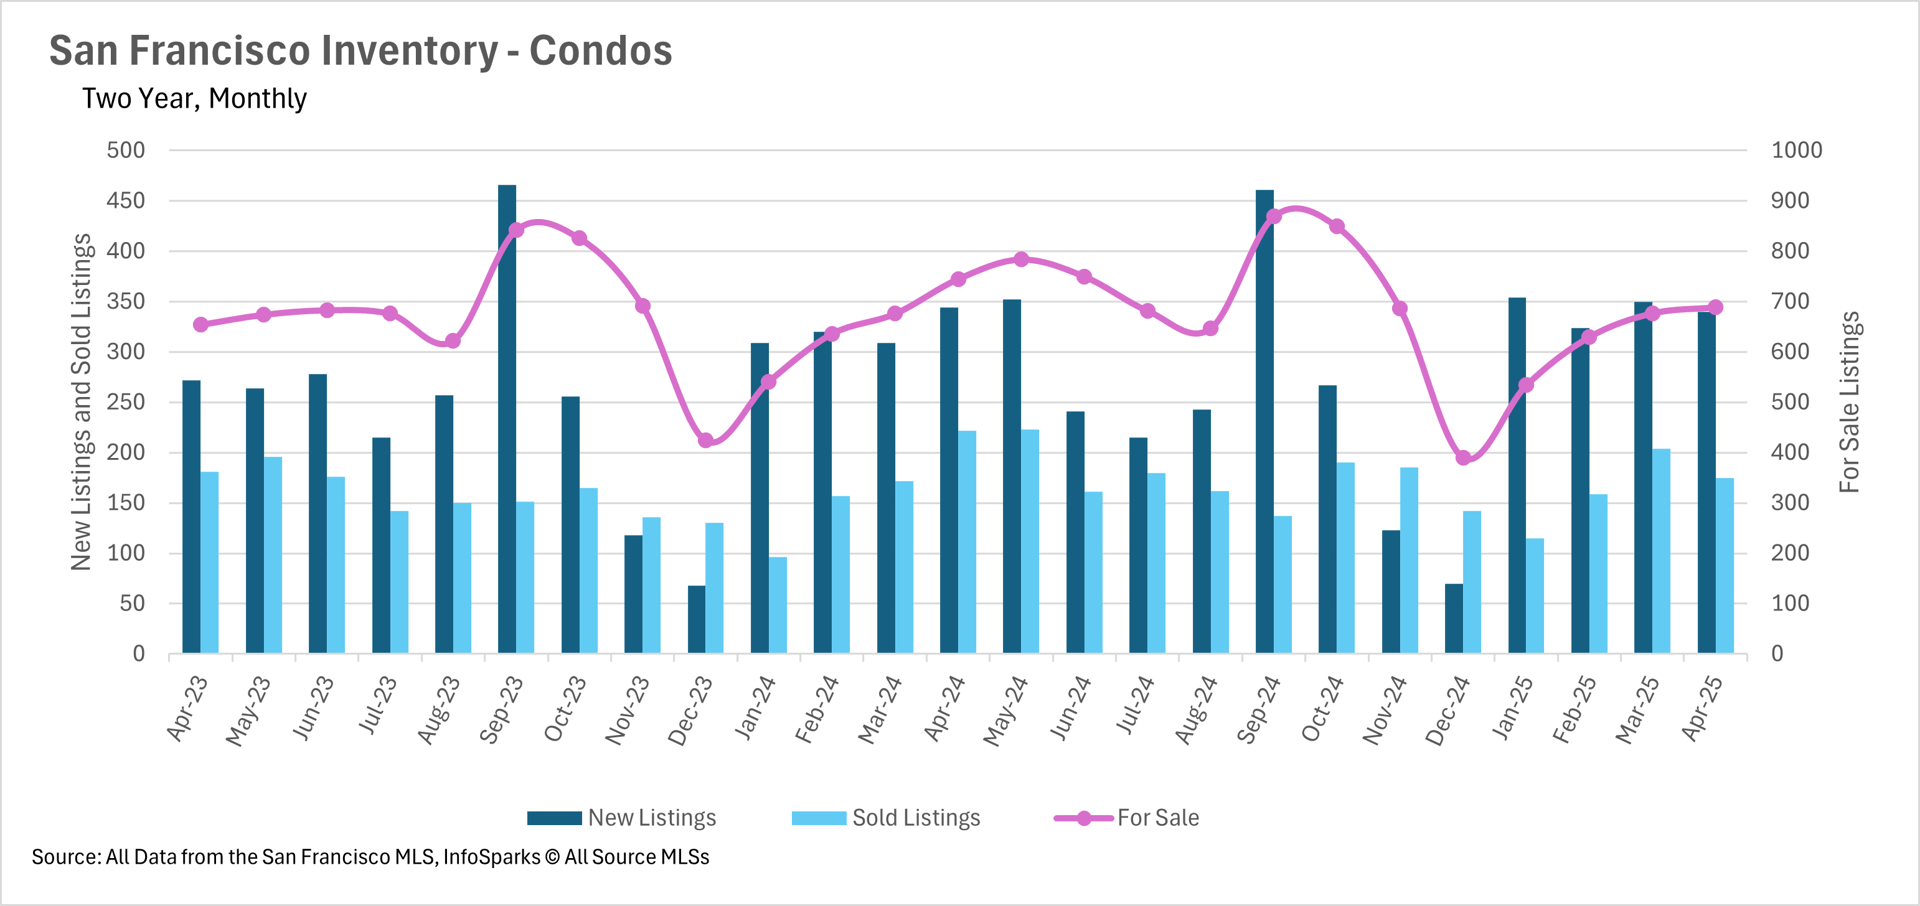
-
San Francisco continued to struggle, with fewer new listings and a sharp 21% drop in condo sales.
2. Homes Still Selling Quickly
Despite fluctuating inventory:
-
Silicon Valley remains the fastest-moving market (Santa Clara homes sell in just 8 days).
-
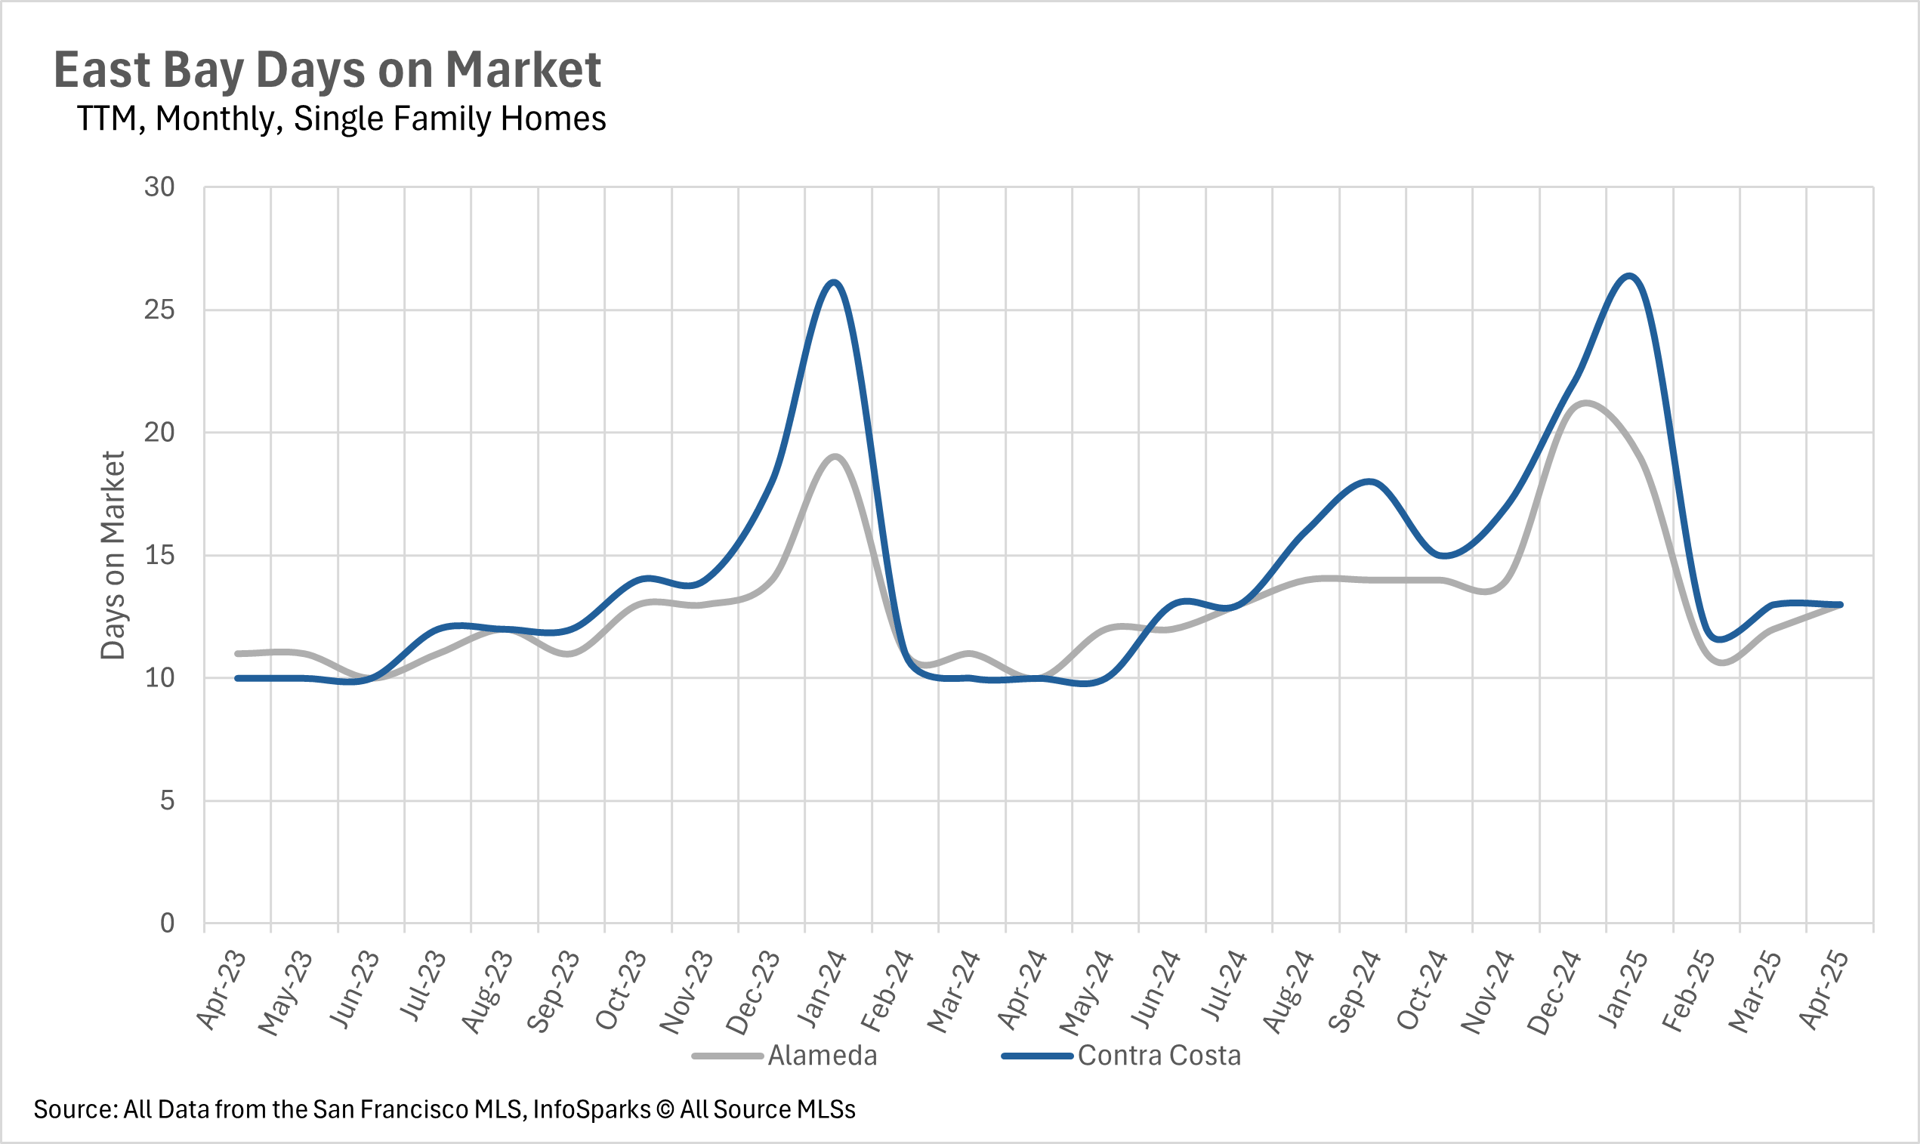
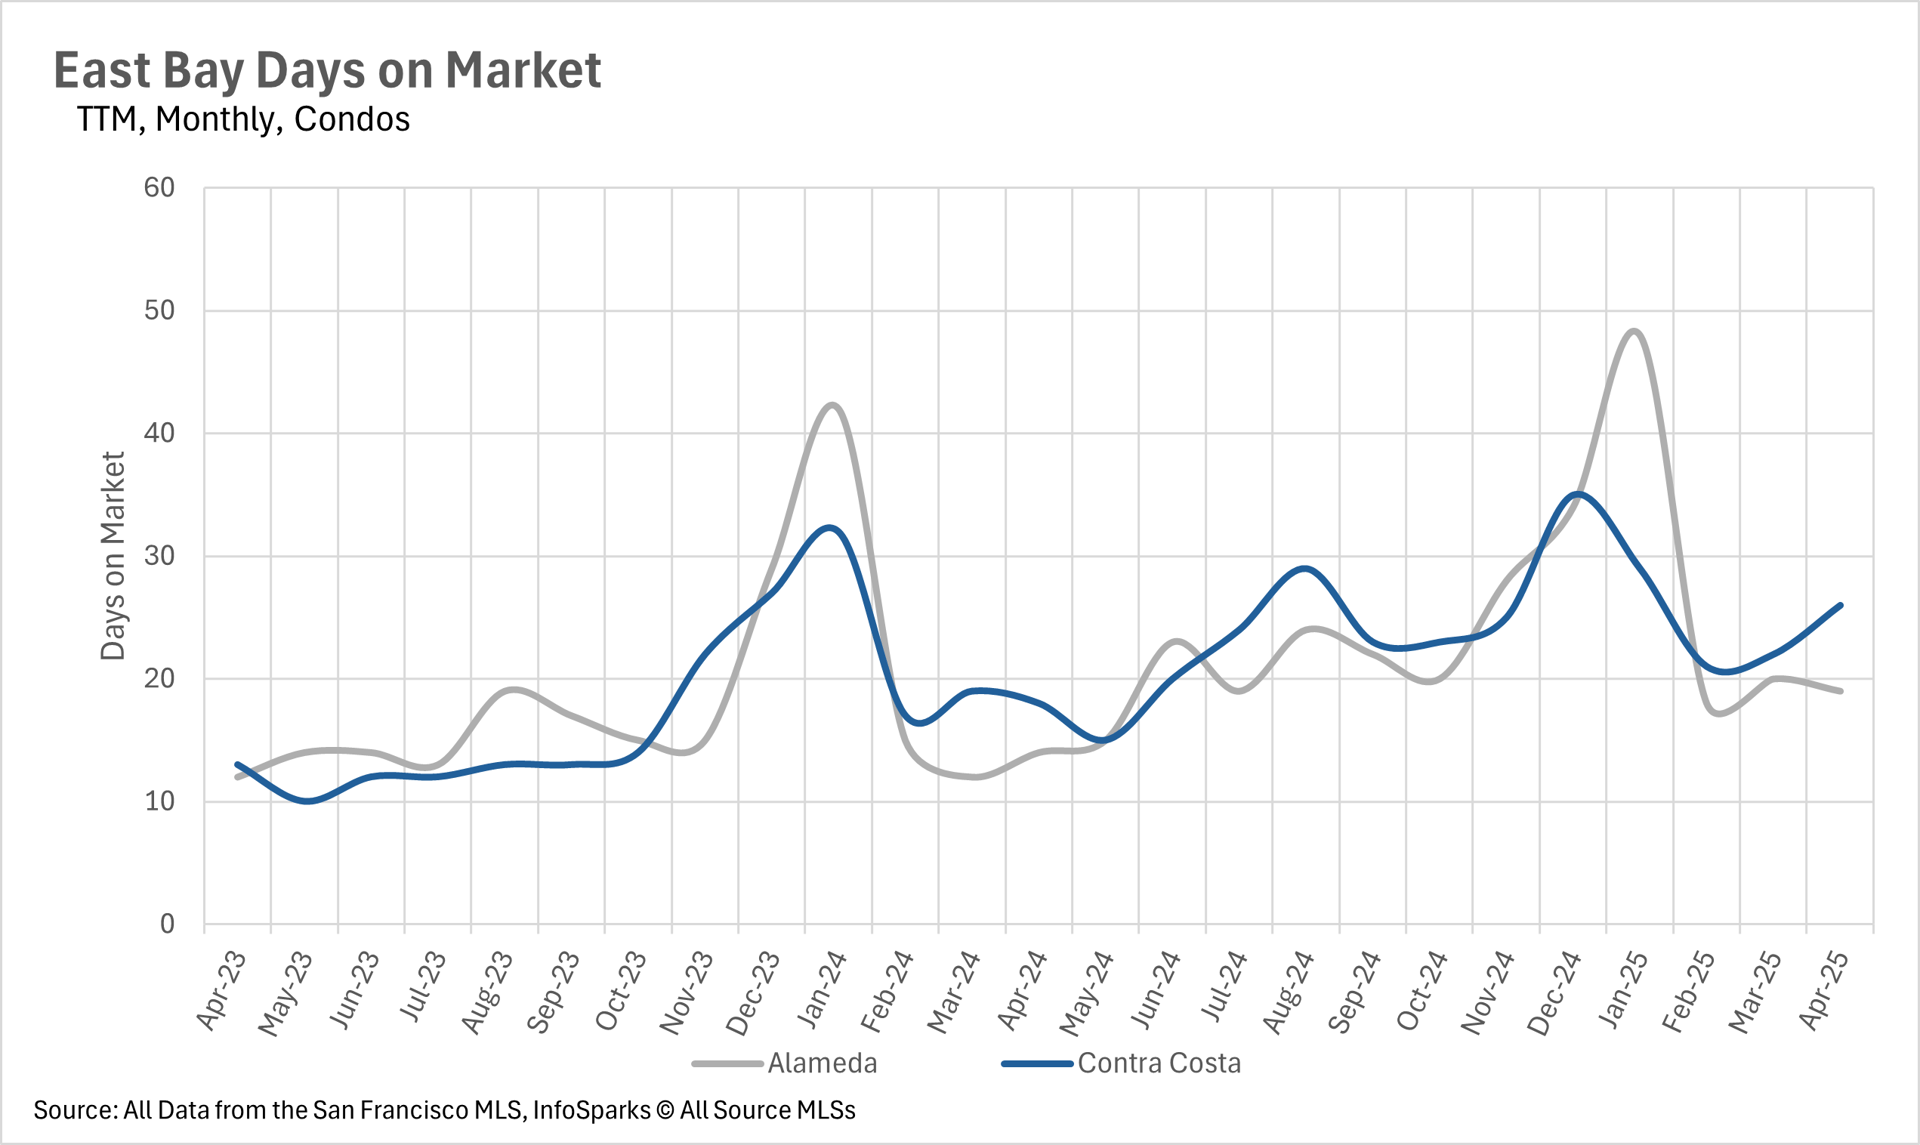
East Bay homes typically sell in 13 days (condos in 19–26 days).
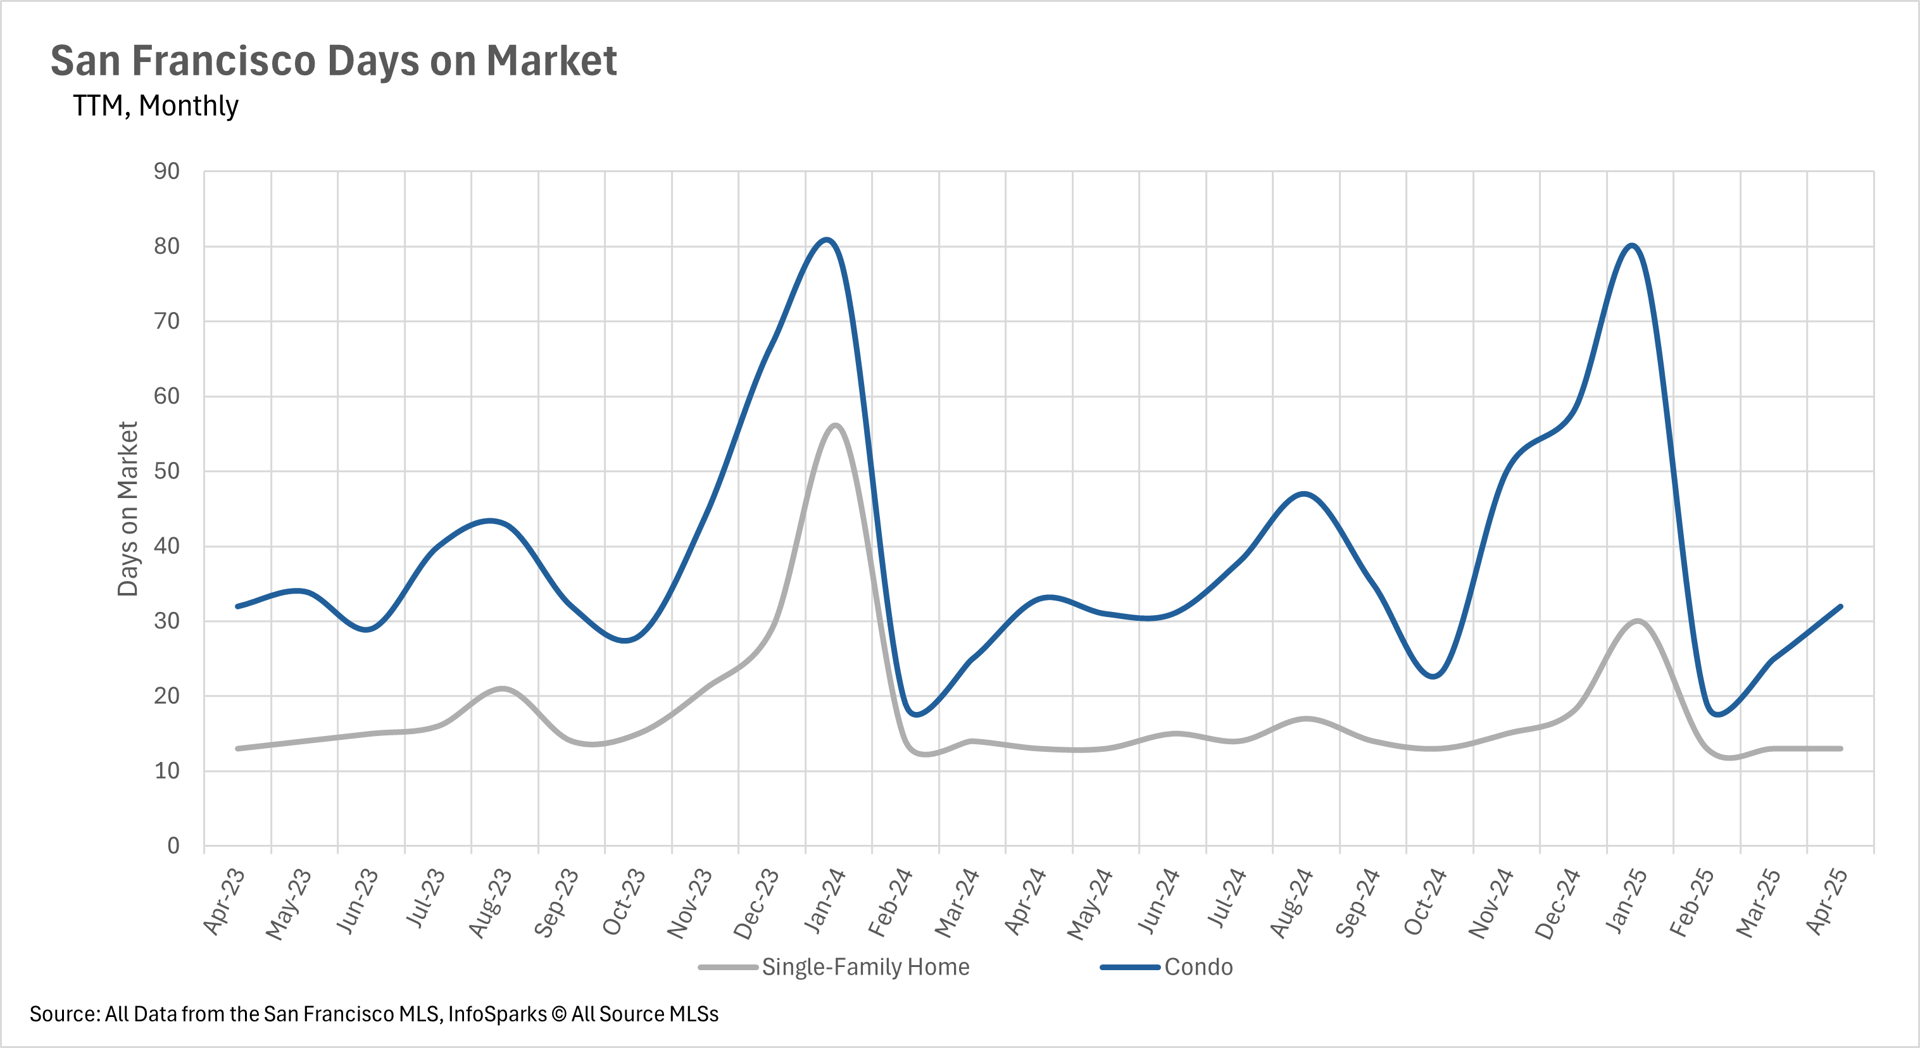
-
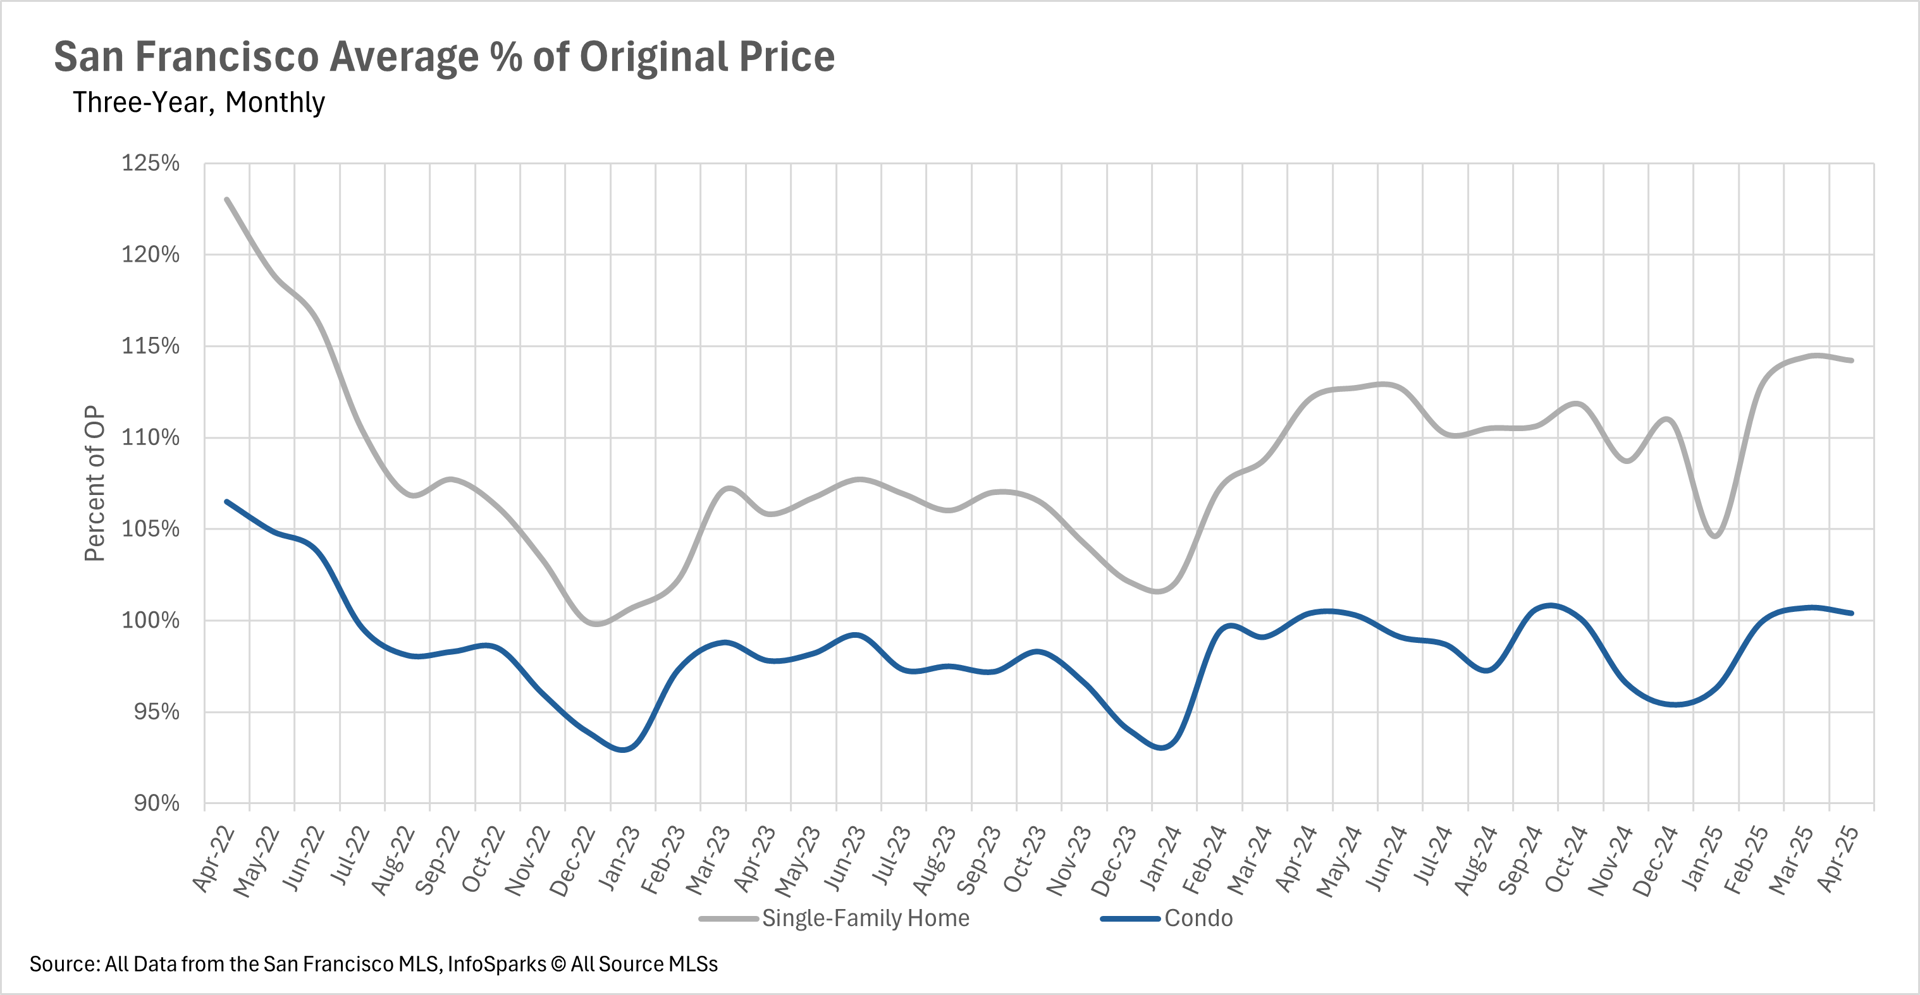
San Francisco homes sell fast and often above asking, with an average 14.2% premium for single-family homes.
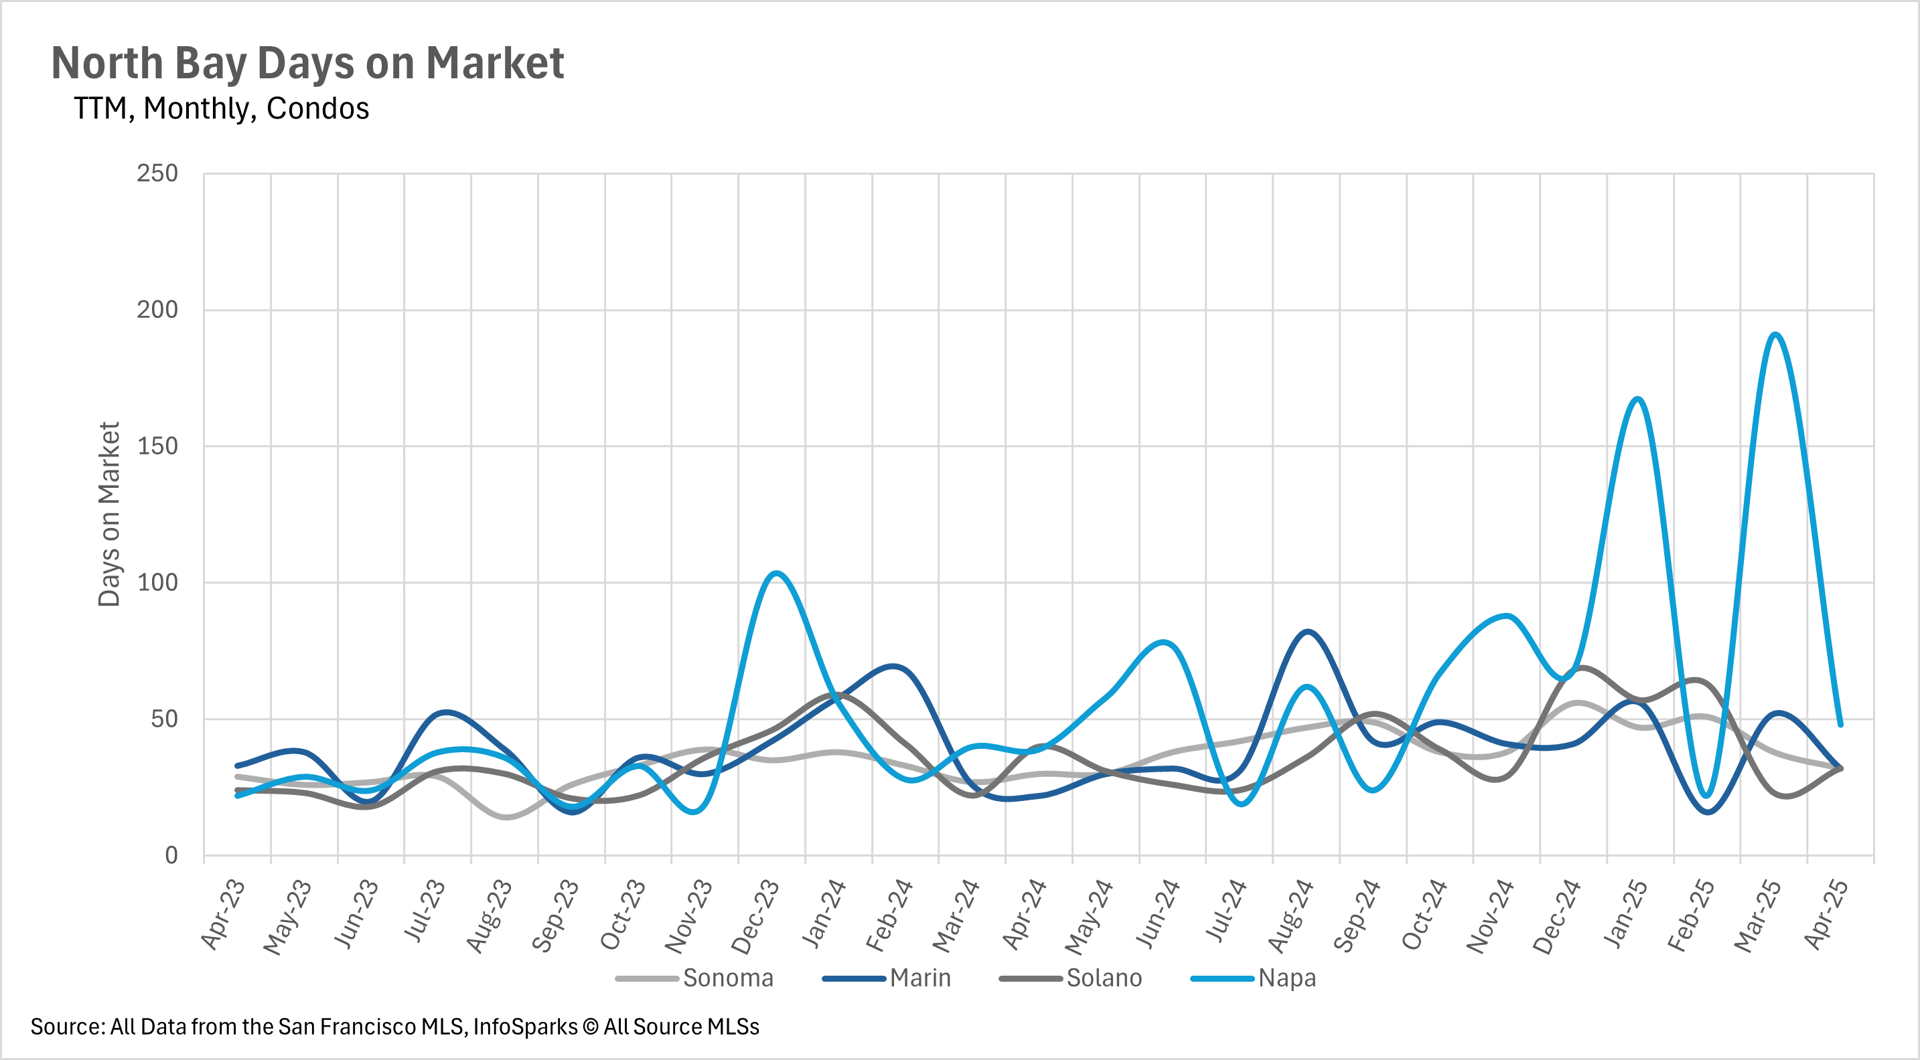
-
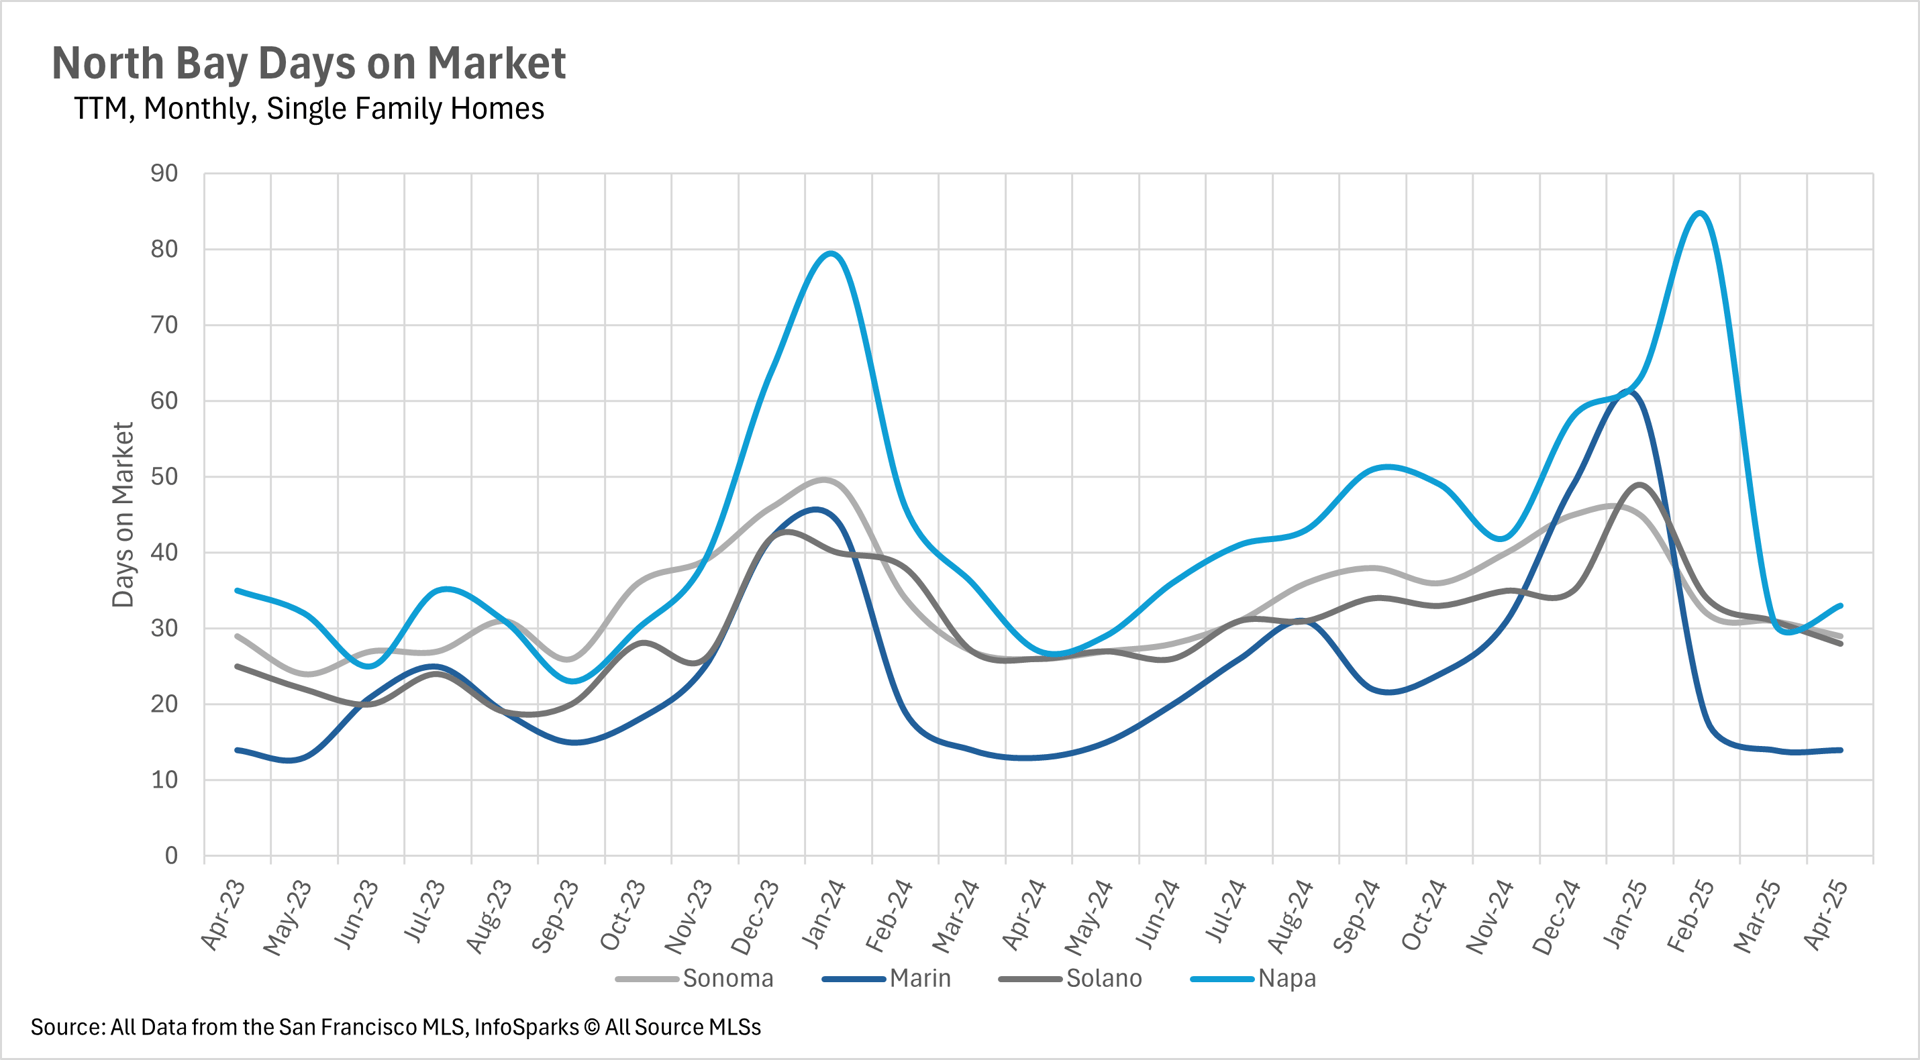
North Bay homes are taking slightly longer but still moving at a steady pace.
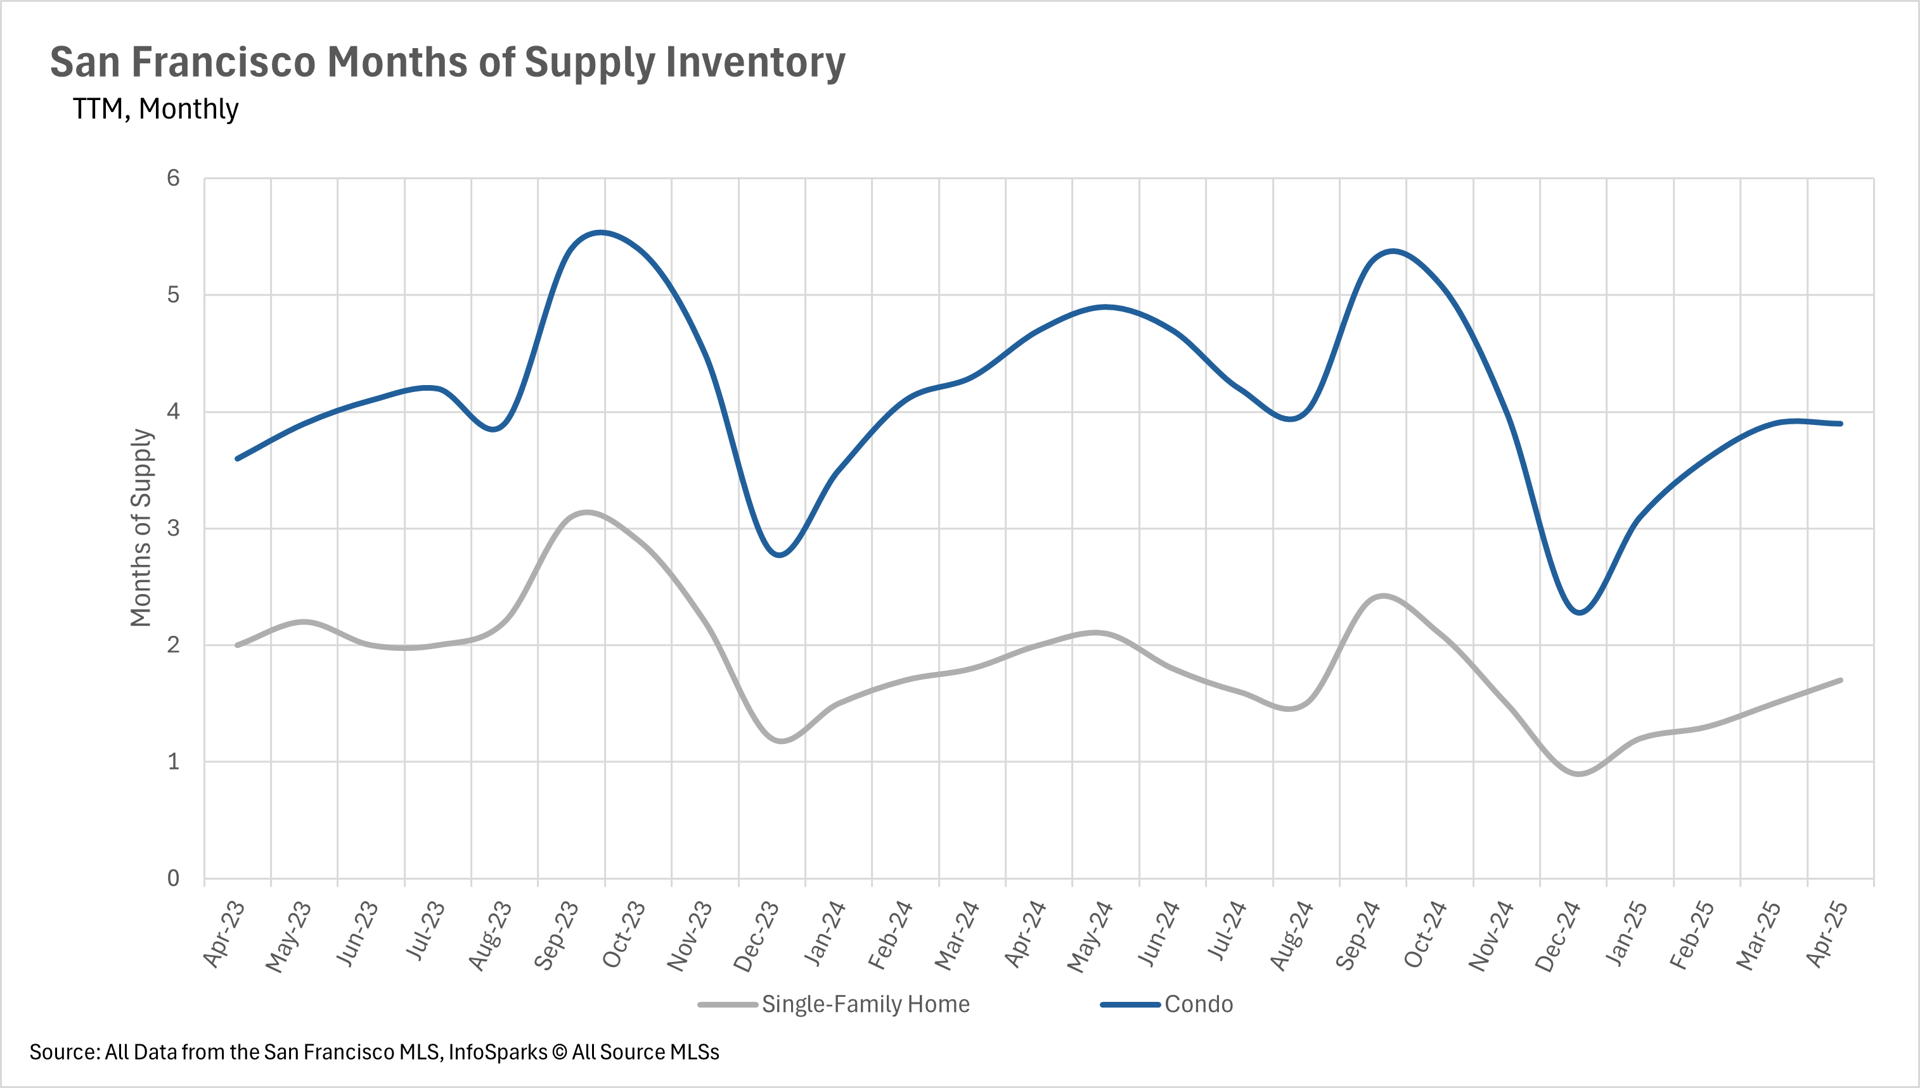
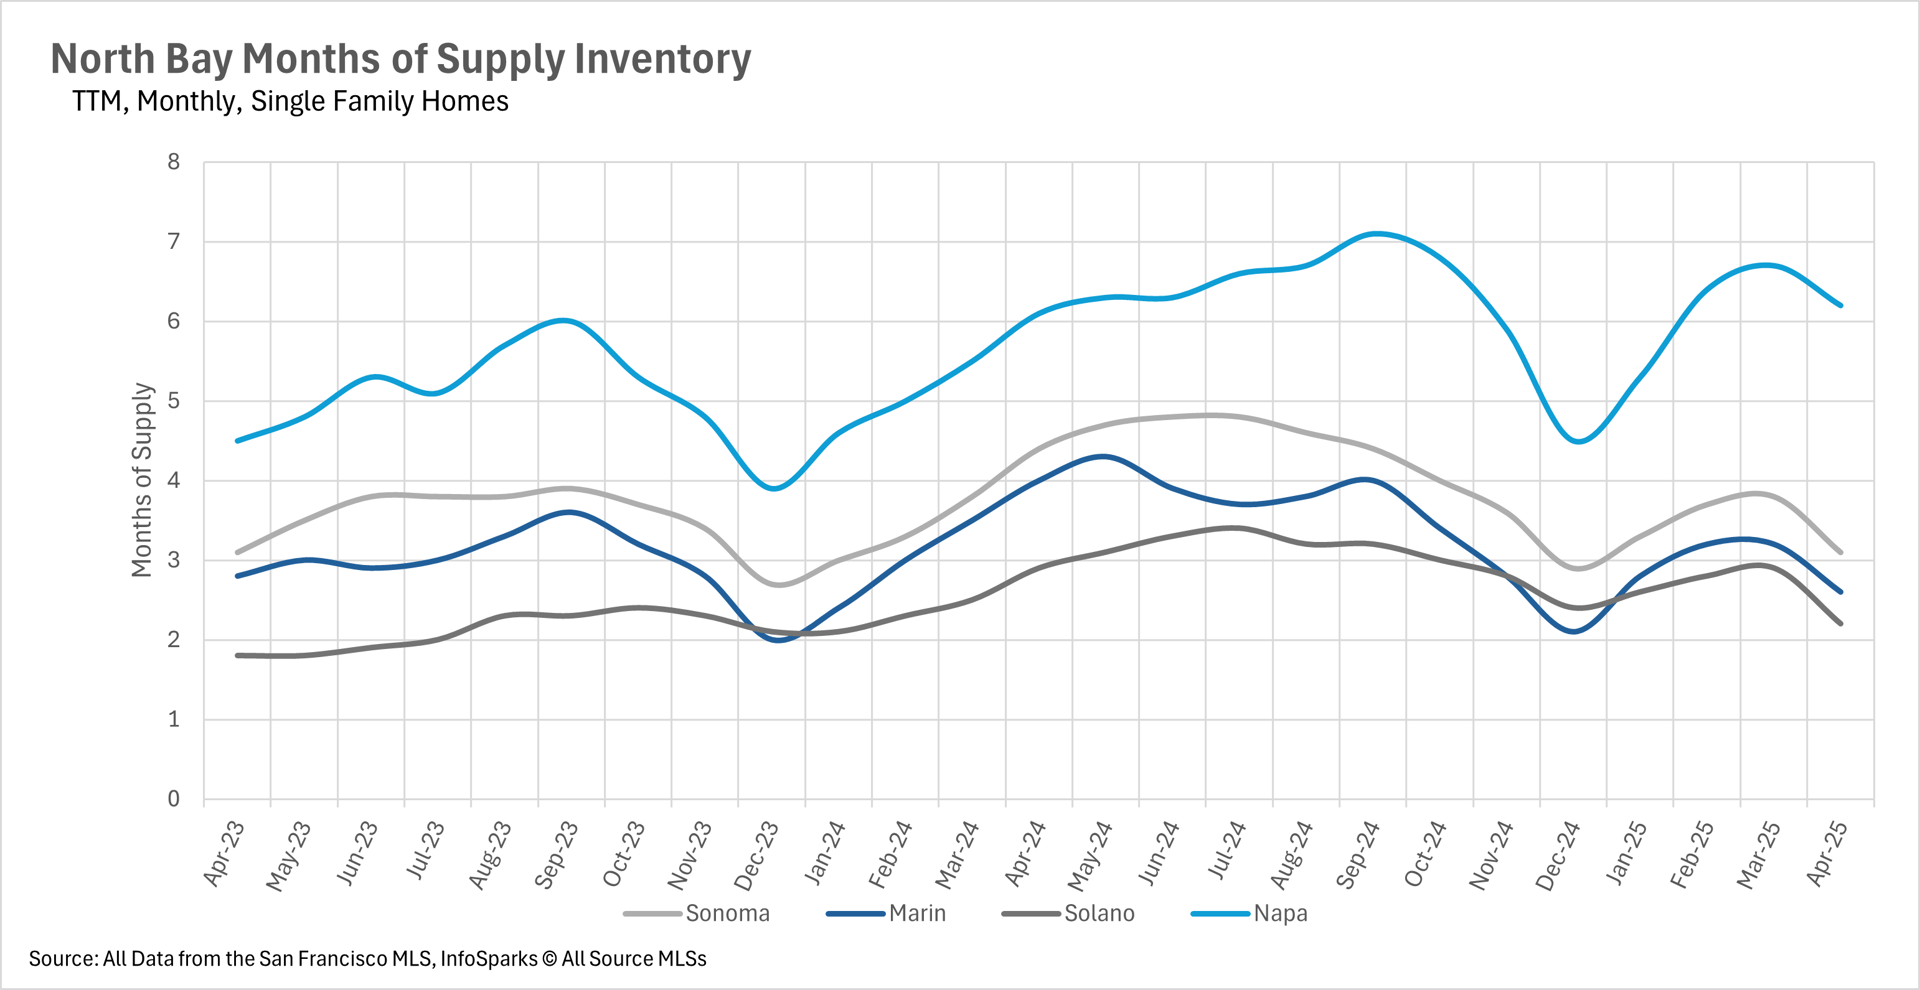
3. Market Conditions: Sellers Rule for Houses, Buyers Win on Condos
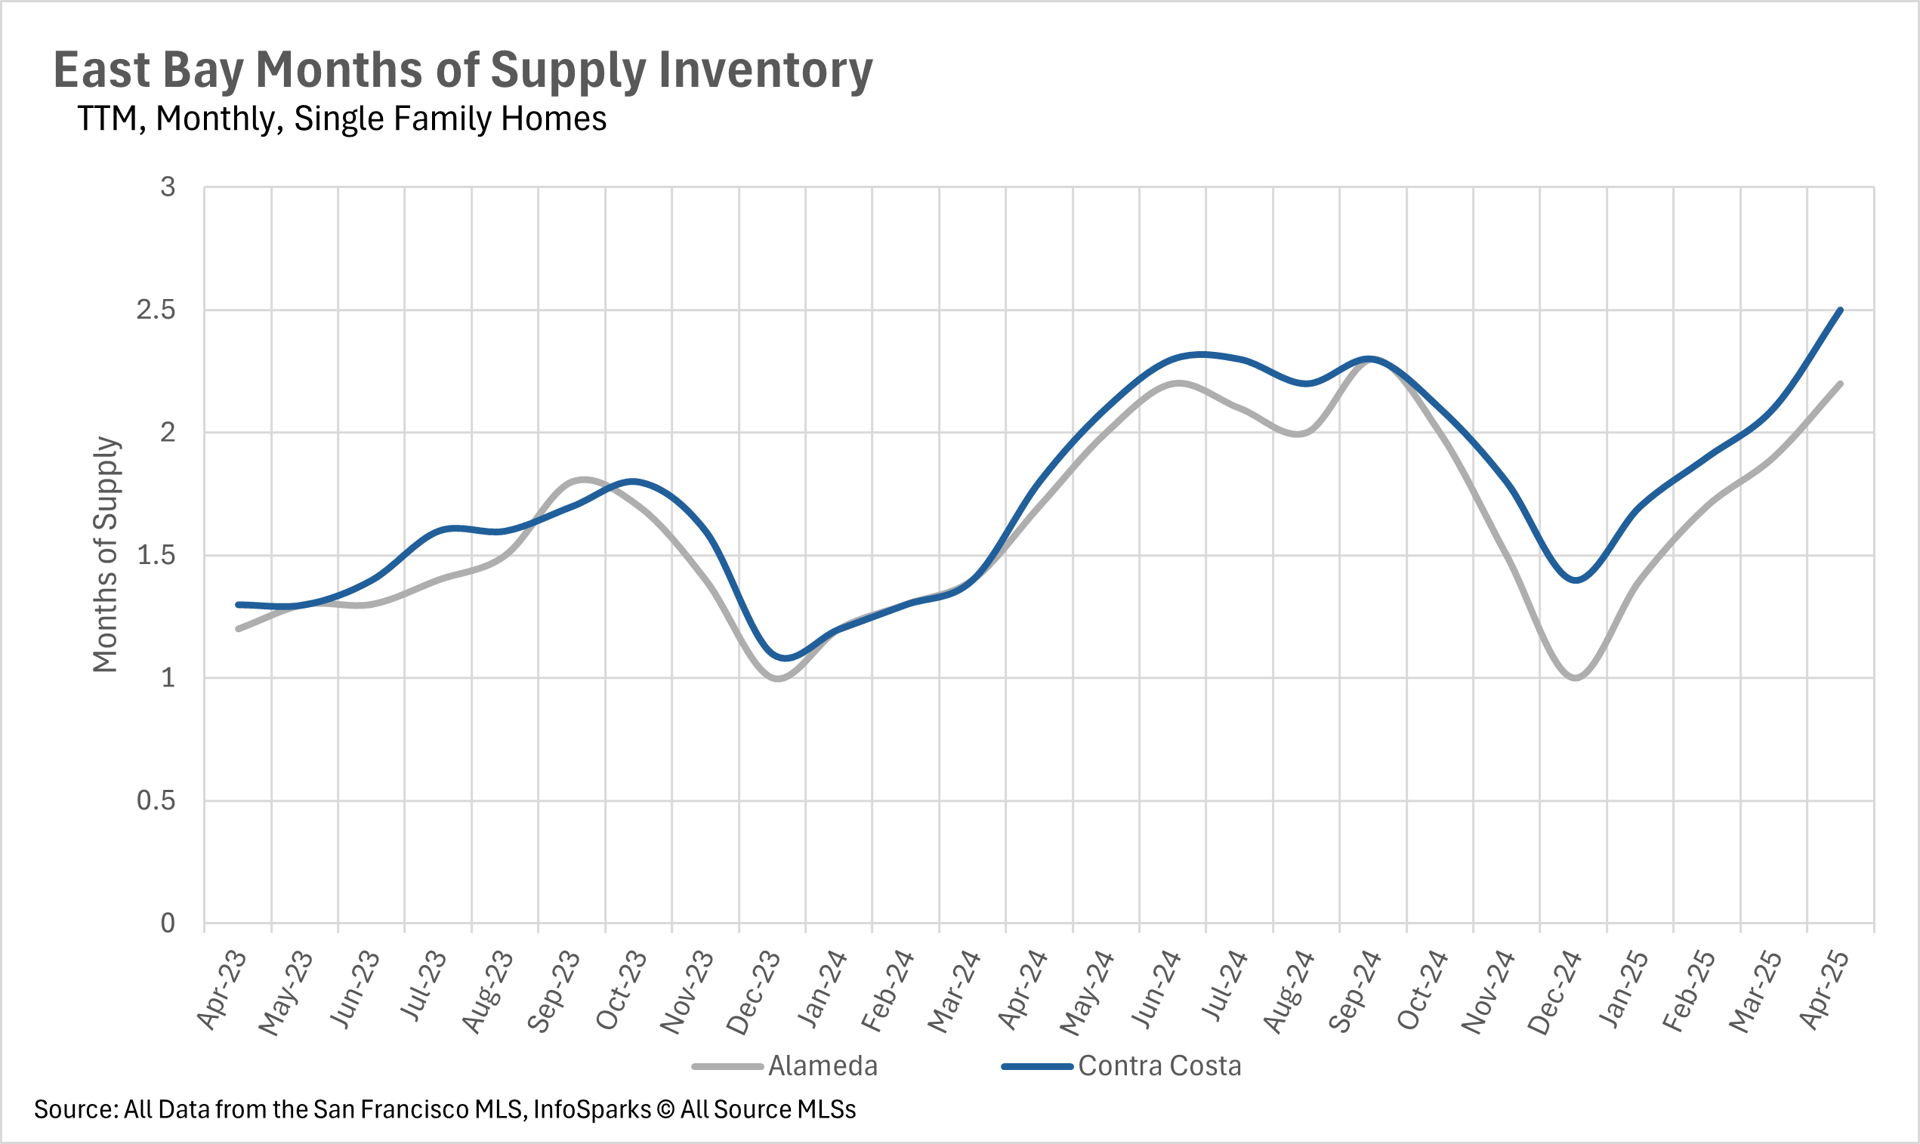
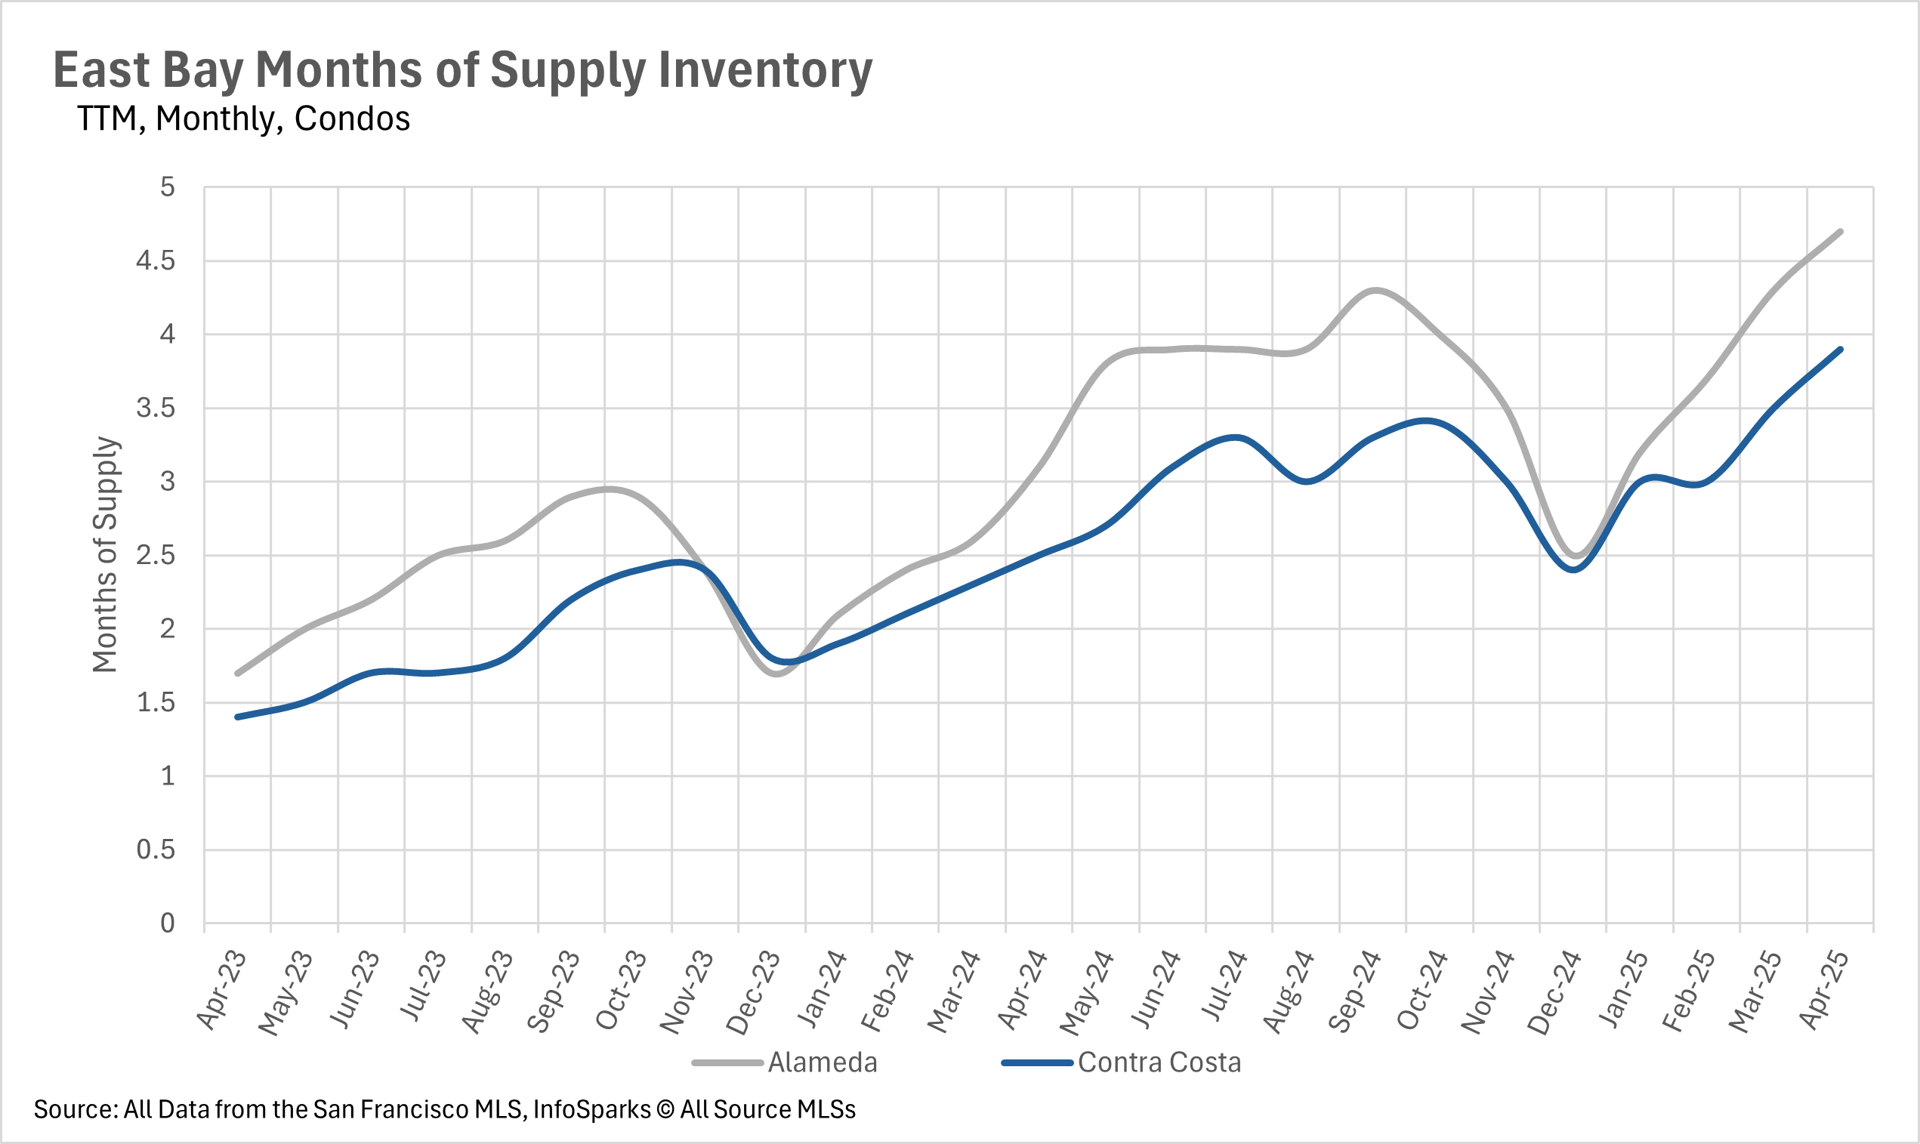
The Months of Supply Inventory (MSI) reveals:
-
Single-family homes throughout the Bay Area are mostly in a seller’s market (e.g., 1.7 months of supply in SF, Santa Clara, and San Mateo).
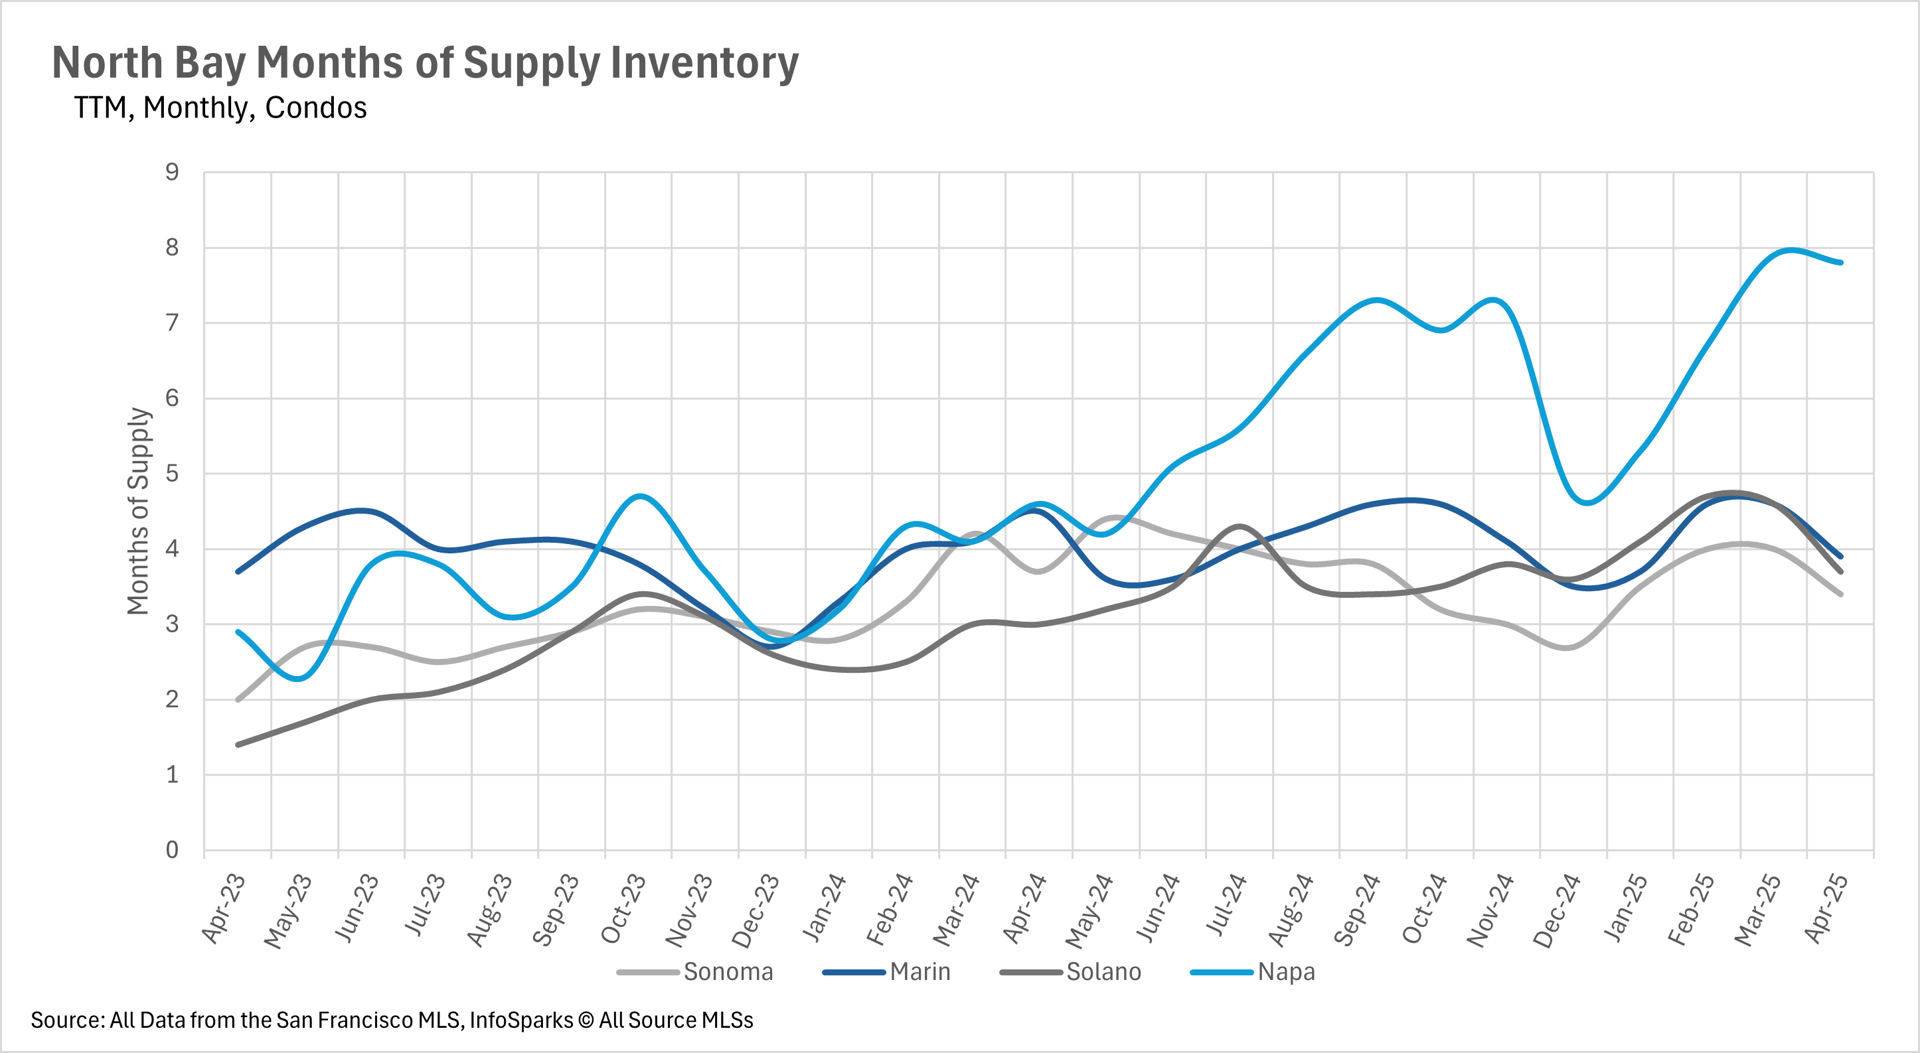
-
Condos, however, favor buyers in many areas — like Alameda (4.7 MSI) and Napa (6.2 MSI).
-
This reflects ongoing buyer preference for detached homes, even as condo options grow.
LOCAL LOWDOWN DATA