January '24 Market Update

Market Update

January '24 Market Update

The stage is set for 2024 to look a lot different from 2023!

 
Quick Take:
  • The Fed telegraphed that rate hikes are ending, and financial markets expect rate cuts in 2024, which will meaningfully reduce the cost of financing and increase home sales.
  • Home prices are declining slightly, which is normal this time of year, but mortgage rates are keeping the monthly cost of financing a home at or near record highs.
BIG STORY DATA:
 
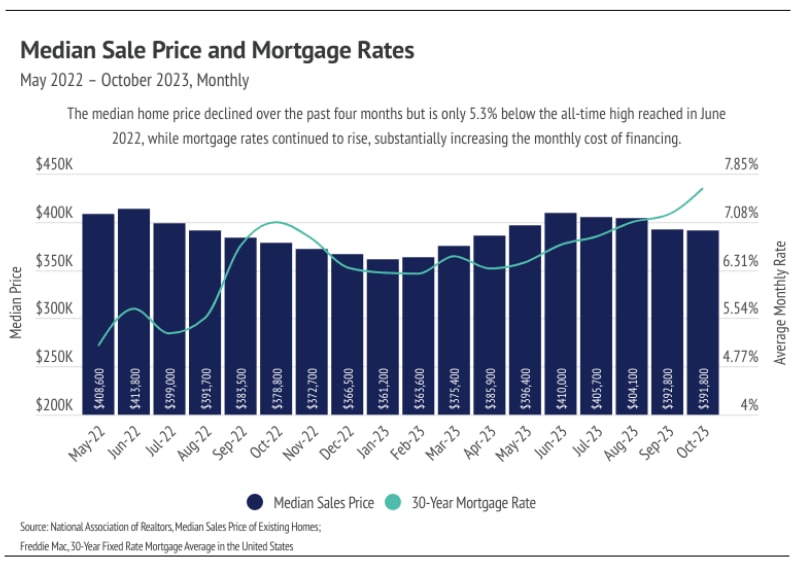
Chart of monthly median home prices and 30-year mortgage rates, May 2022 to October 2023.
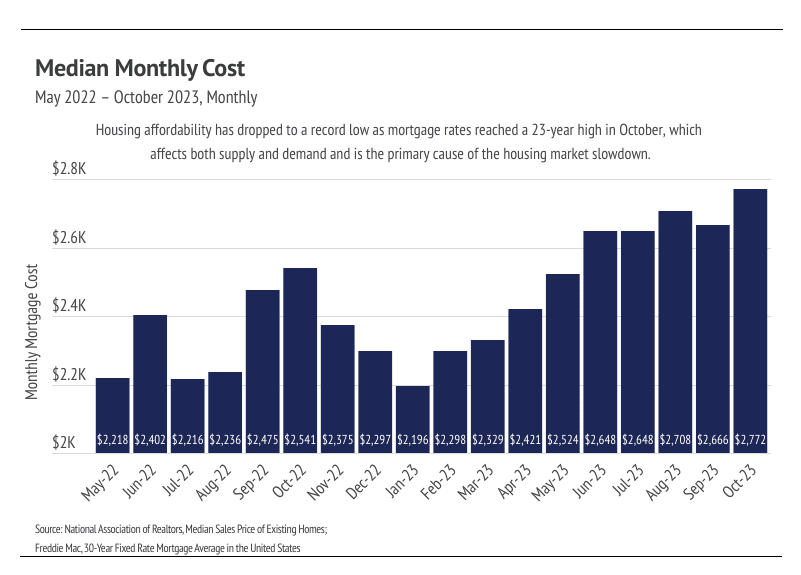
Bar chart of median monthly mortgage costs, rising from $2,218 in May 2022 to $2,772 in October 2023.
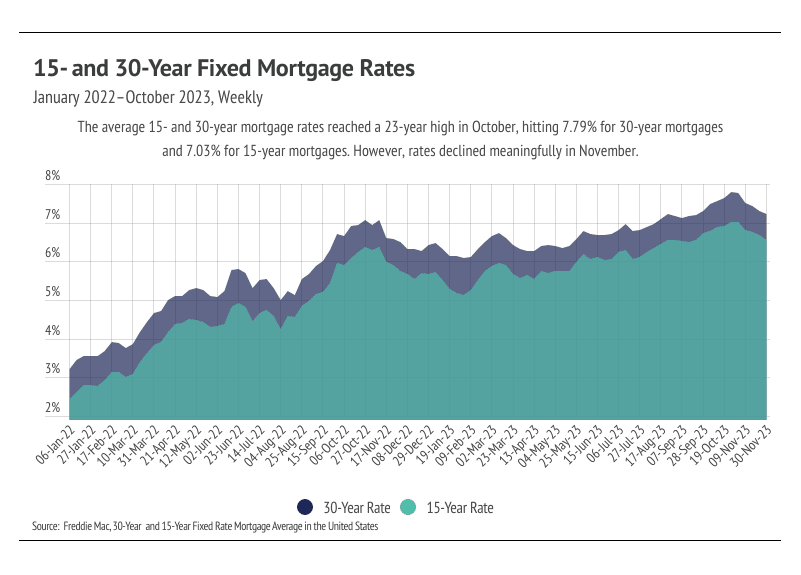
Chart of 15- and 30-year mortgage rates rising from January 2022 to October 2023, with October peaks.
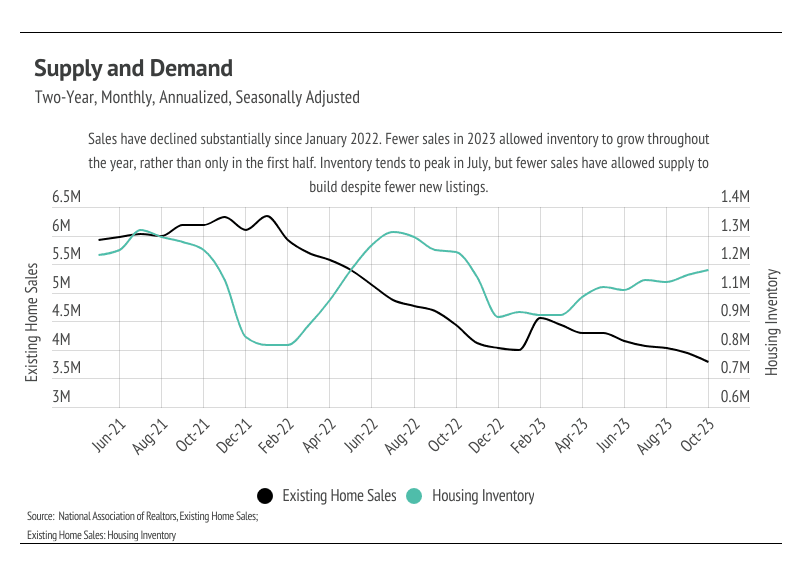
Line chart showing existing home sales declining and housing inventory rising from June 2021 to October 2023.
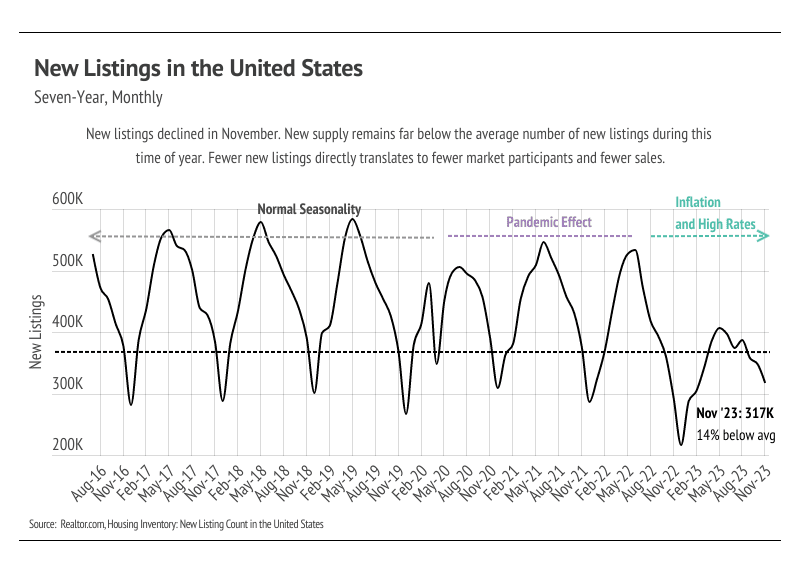
Line chart of U.S. new listings, with November 2023 at 317K, 14% below average.
LOCAL LOWDOWN:
 
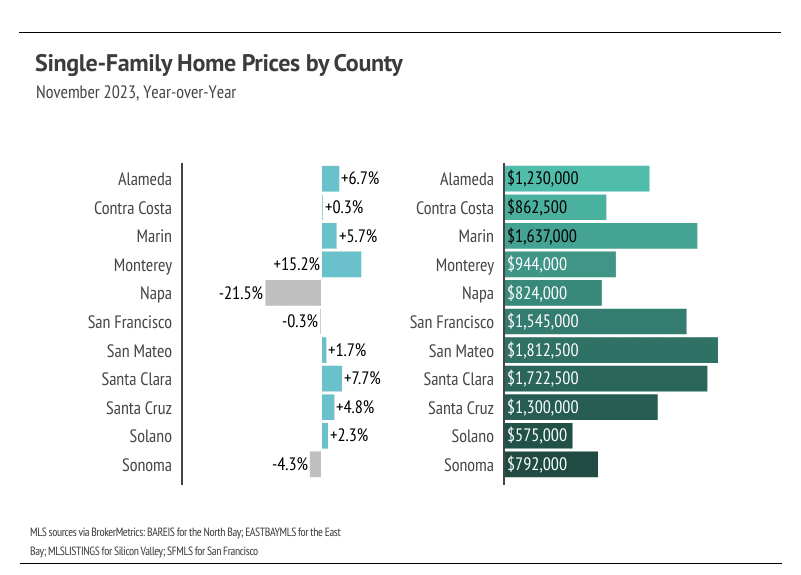
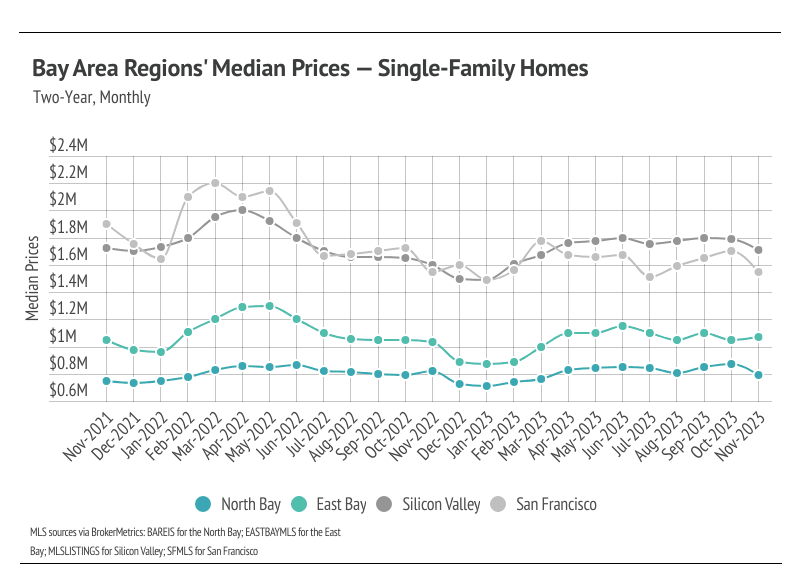
  • Year over year, the median single-family home prices rose across most Bay Area counties in November, staying in line with the six-month horizontal price trend. We expect that trend to continue until interest rates drop and more sellers come to the market.
  • Active listings, sales, and new listings fell month over month for single-family homes and condos. Inventory will likely decline more over the next few months before rising in the spring.
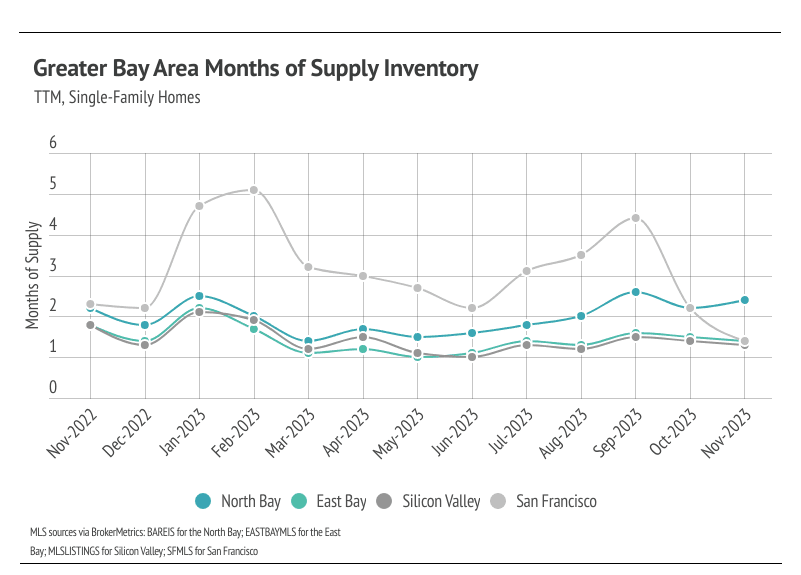
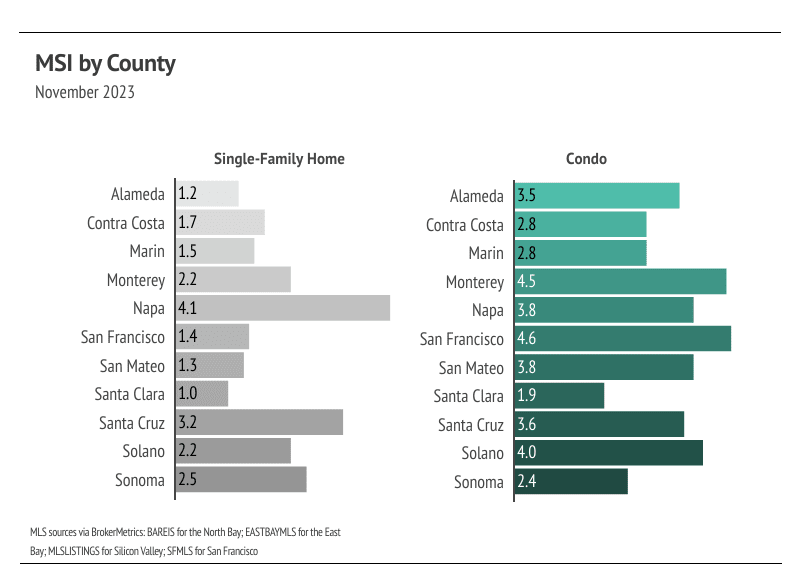
  • Months of Supply Inventory indicates the single-family home market still strongly favors sellers, but the condo market has shifted toward a balanced market. It’s common for MSI to trend higher in the fall and winter, when fewer buyers are in the market and sales slow.

Line chart comparing monthly single-family home median prices across four Bay Area regions, November 2021–November 2023.

Chart of November 2023 single-family home prices and year-over-year changes across 11 Northern California counties.

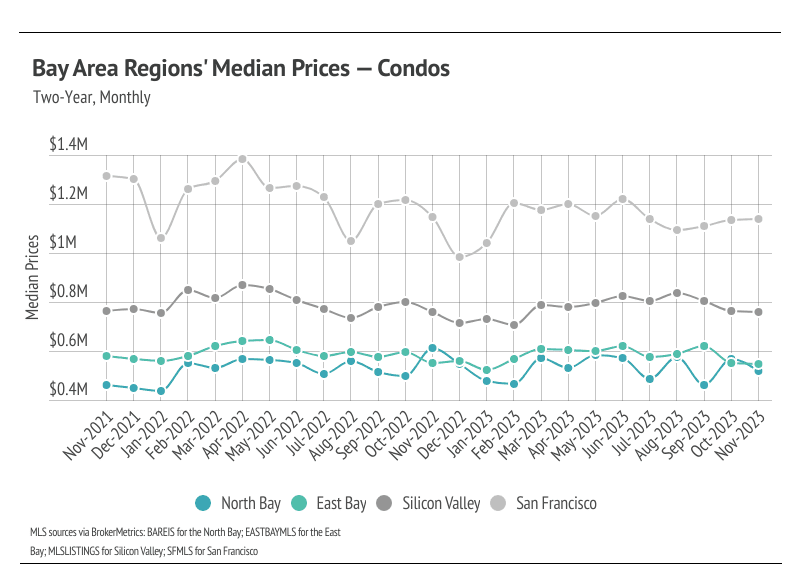
Line chart comparing monthly median condo prices across four Bay Area regions, November 2021 to November 2023.

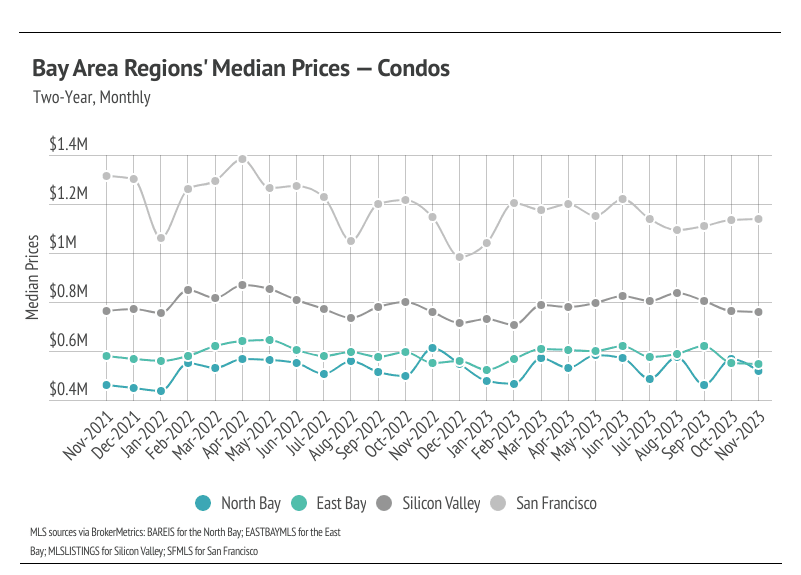
Line chart of Bay Area condo median prices by region, November 2021 to November 2023.

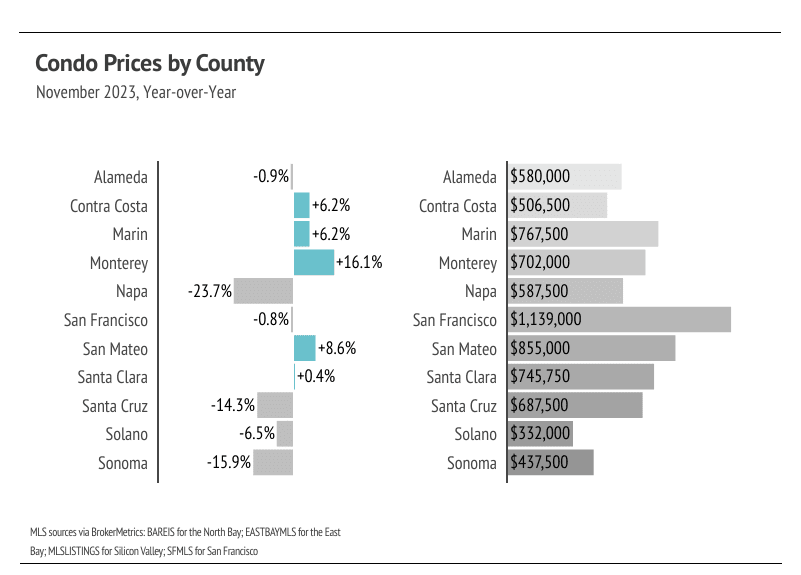
Chart of November 2023 Bay Area condo prices by county and year-over-year changes.

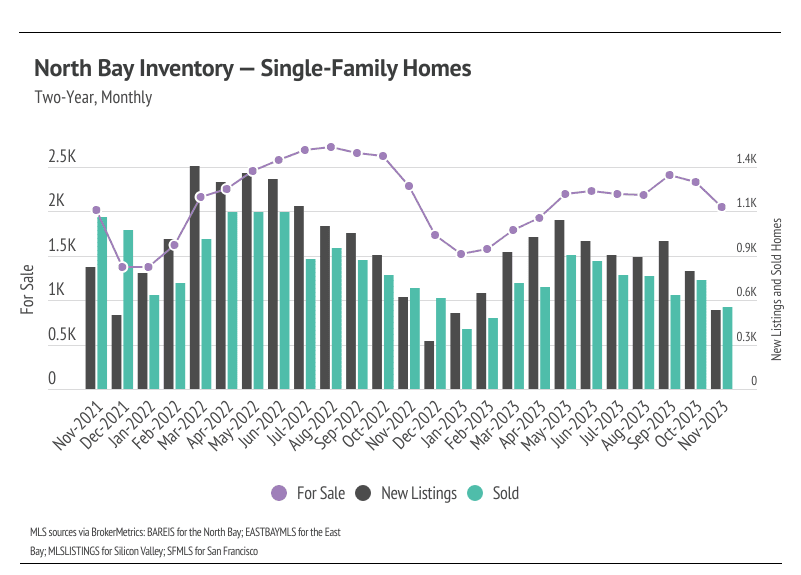
North Bay single-family home market chart comparing monthly inventory, new listings, and sales from November 2021 to November 2023.

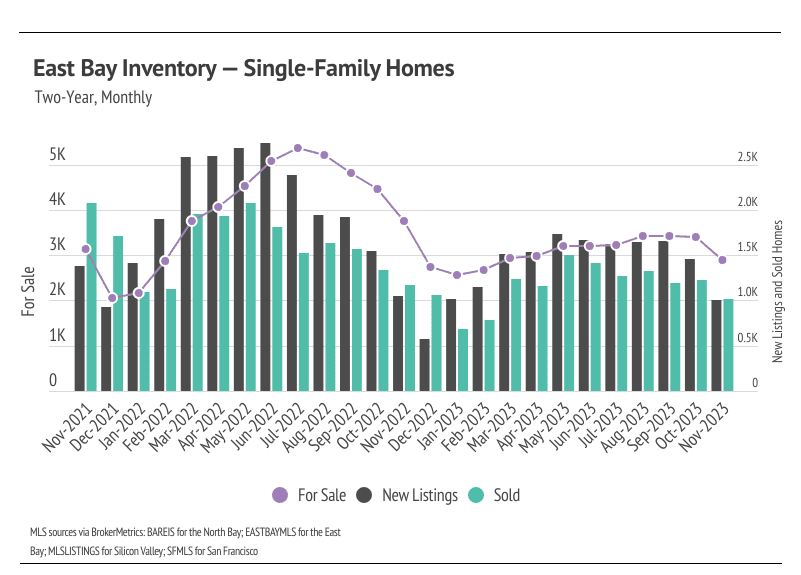
Chart of East Bay single-family home inventory, with monthly new listings, sales, and homes for sale from November 2021 to November 2023.

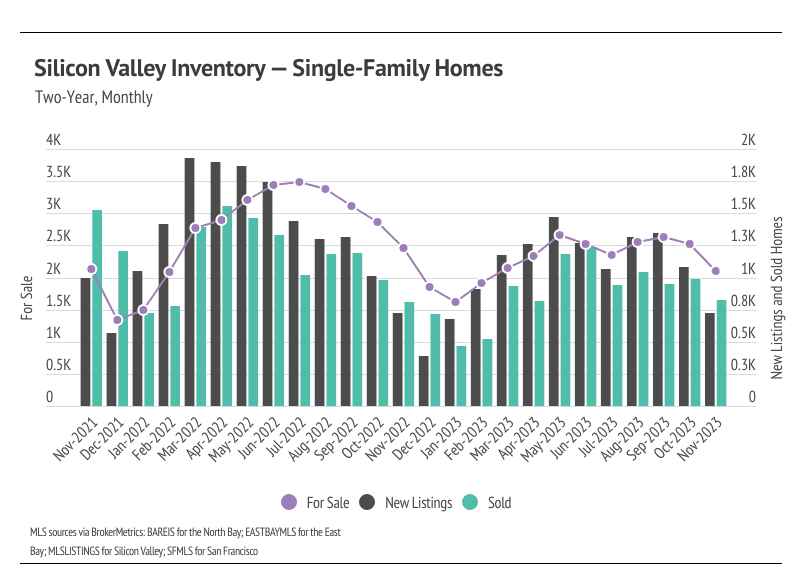
Chart of Silicon Valley single-family home inventory from November 2021 to November 2023, showing homes for sale, new listings, and sales.

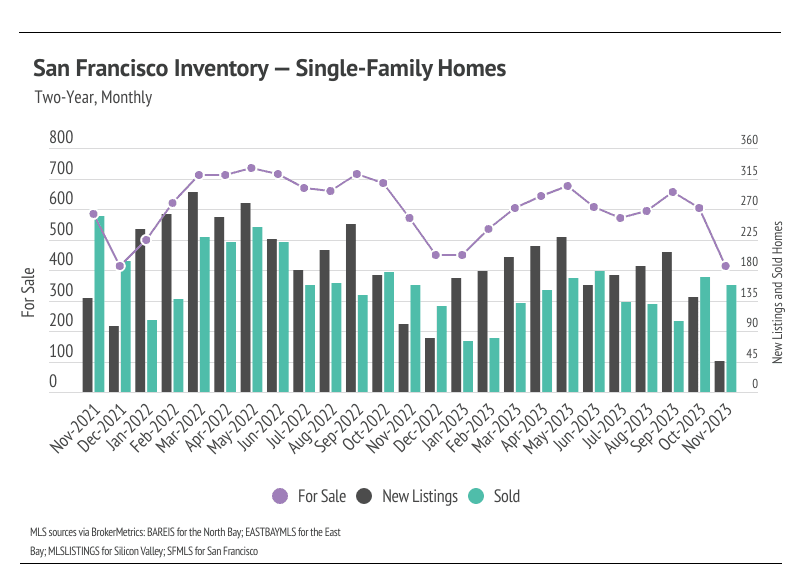
Chart of San Francisco single-family home inventory, with monthly sales, new listings, and homes for sale from November 2021 to November 2023.

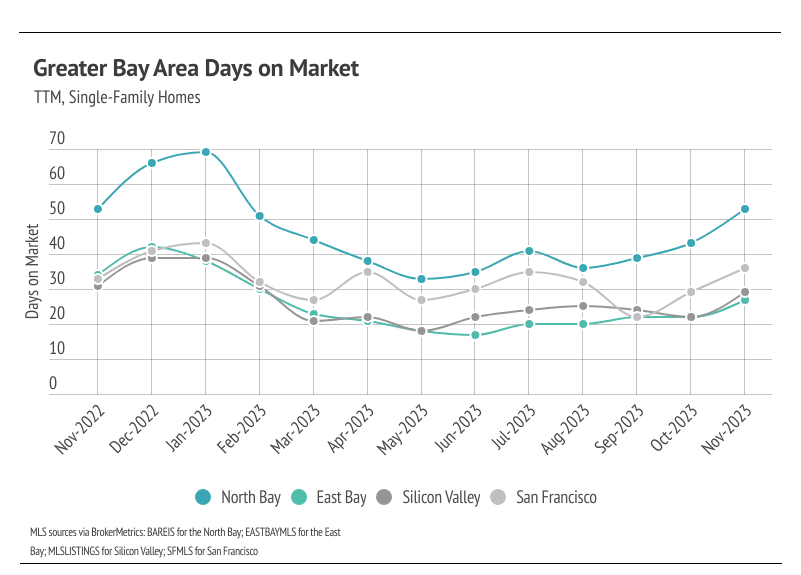
Line chart comparing days on market for single-family homes across four Bay Area regions, November 2022 to November 2023.

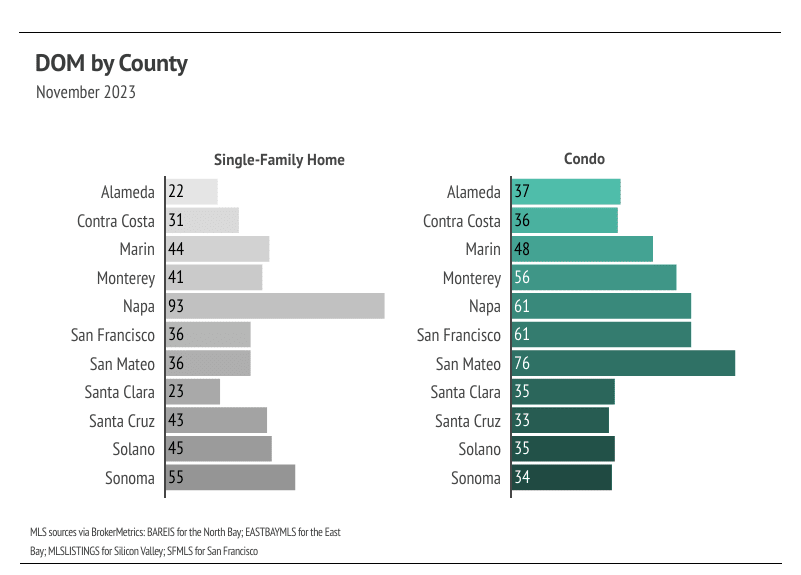
November 2023 days-on-market bar chart by county for single-family homes and condos.

Line chart of Greater Bay Area housing supply, November 2022–November 2023; San Francisco peaks near five months in February.

November 2023 months-of-supply chart comparing single-family homes and condos across Bay Area counties.

CLINK LINKS and FOLLOW US for more updates!
 
Visit our Page: Milestone Realty - Buy & Sell in Greater Silicon Valley, Almaden & Willow Glen (remilestone.com)


Let's Talk

You’ve got questions and we can’t wait to answer them.
Set Up Your Search for New Homes

Check It Out