January 2025: Silicon Valley Real Estate Market Insights

Market Update

January '25 Market Update

ELEVATED RATES ARE HERE TO STAY

Quick Take:
  • Home prices declined modestly in Q4 2024, showing atypical price stability in the second half of the year. Because prices didn’t contract significantly in the second half of 2024, they will easily rise to new highs in 2025.
  • Since September 2024, the Fed has cut rates by 1%, bringing the interest rate that banks charge each other for short-term loans to a range of 4.25% to 4.5%. In 2025, we only expect the federal funds rate to decline by another 25 to 50 bps.
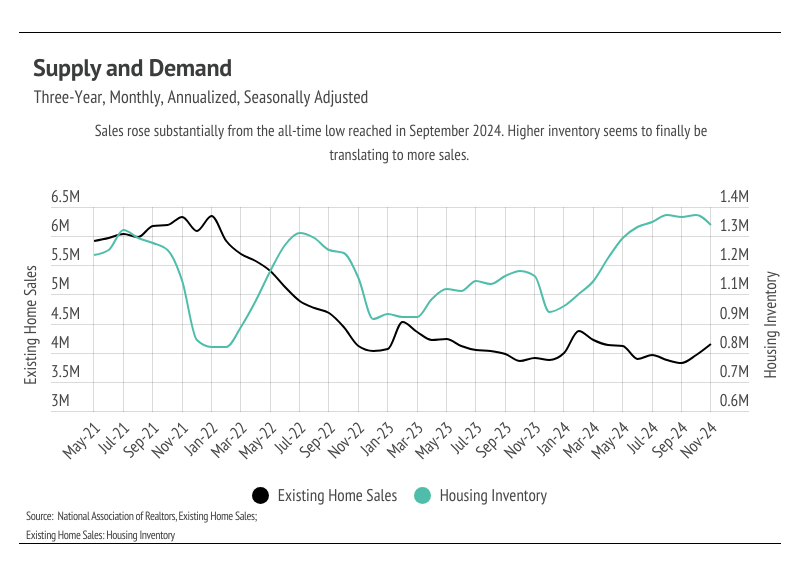
  • Sales rose 4.8% month over month, the swiftest pace since March. Sales accelerated 6.1% from one year ago, the largest year-over-year gain since June 2021. At the same time, inventory fell 2.9% but is still near its highest level in the past four years. Higher inventory levels created more opportunity for sales.

Economic (policy) uncertainty elevated mortgage rates

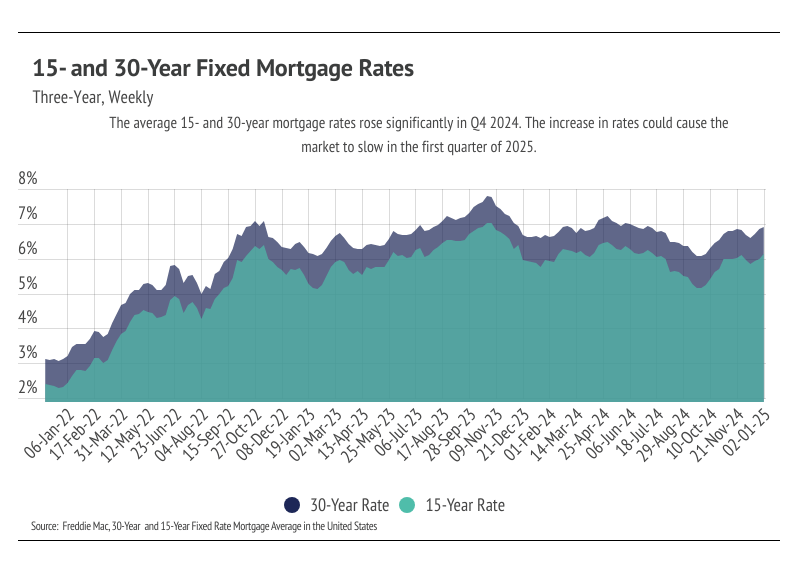
The Federal Reserve cut interest rates by 1% in 2024, but mortgage rates remain high, with the average 30-year fixed-rate mortgage reaching 6.91% on January 2, 2025, its highest in six months. This is due to external factors like economic growth, inflation concerns, and 10-year Treasury bond yields. Economists, including Lawrence Yun of the National Association of Realtors, expect mortgage rates to stay elevated between 6% and 7% in 2025, averaging around 6.5%.

Economic uncertainty persists as President-elect Donald Trump’s proposed policies, including tariffs and tax cuts, may reignite inflation. If inflation rises, the Fed might halt further rate cuts, though analysts suggest some of Trump’s proposals could be strategic rather than definite. The Fed projects two additional rate cuts for 2025, down from the four initially planned, as inflation trends remain cautious.

Despite high mortgage rates, home sales have surged in recent months due to increased inventory and a broader acceptance of elevated rates by buyers and sellers. Higher inventory has created a better overall buying experience with less competition, and many have concluded that waiting for lower rates is no longer worth it. Economic optimism surrounding the new administration has further boosted sales, highlighting the emotional aspects of homebuying. Local market trends may differ, and continued updates will provide tailored guidance for your buying or selling decisions.

BIG STORY DATA

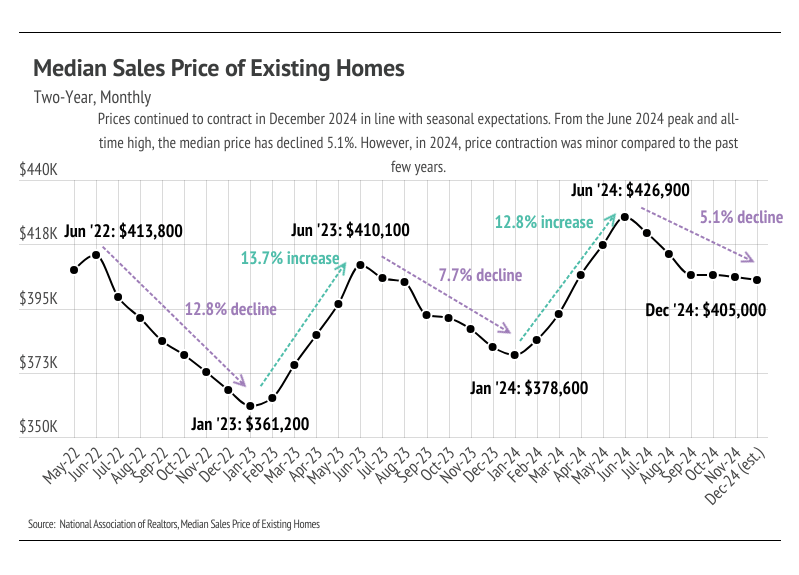
Chart of existing-home median sales prices, May 2022–December 2024, peaking at $426,900 in June 2024.

Chart comparing weekly 15- and 30-year fixed mortgage rates from January 2022 to January 2025.

Chart comparing existing home sales and housing inventory from May 2021 to November 2024.

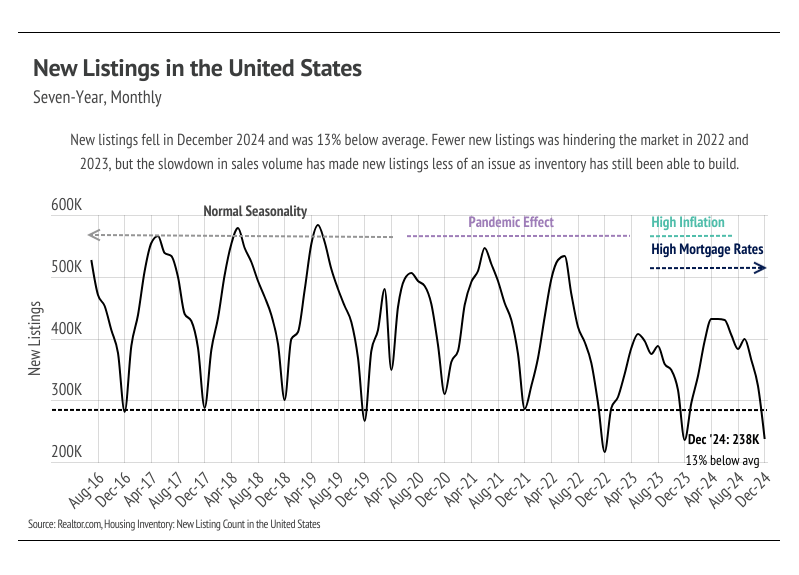
U.S. monthly new listings chart, showing 238,000 listings in December 2024, 13% below average.

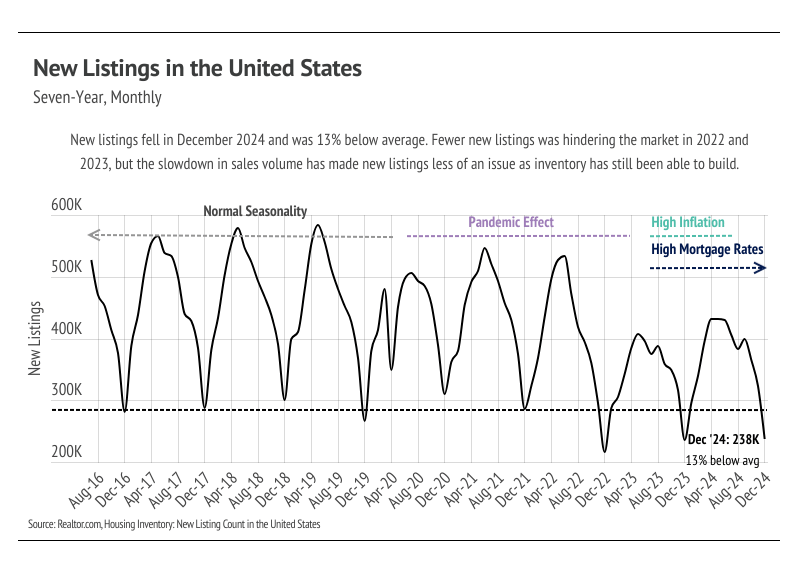
Chart of U.S. new listings from 2016 to 2024, showing December 2024 13% below average.

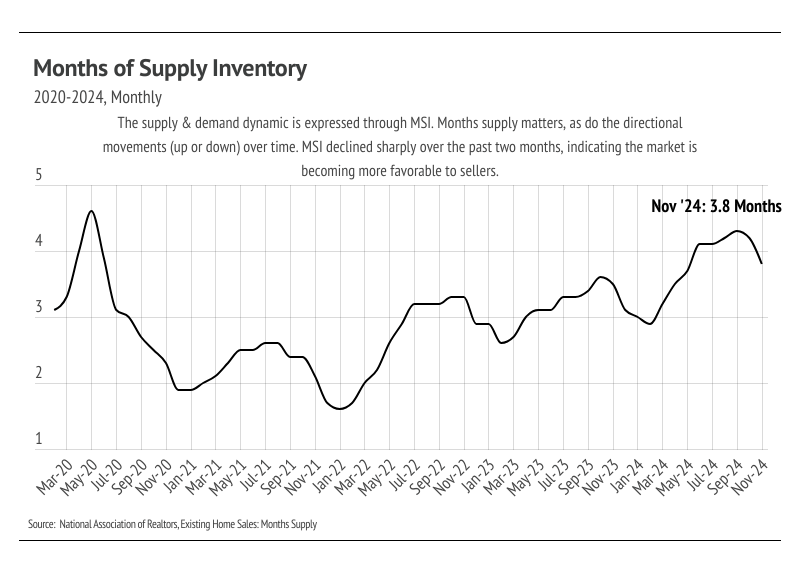
Months of supply inventory from 2020 to 2024, ending at 3.8 months in November 2024.

THE LOCAL LOWDOWN

Quick Take:
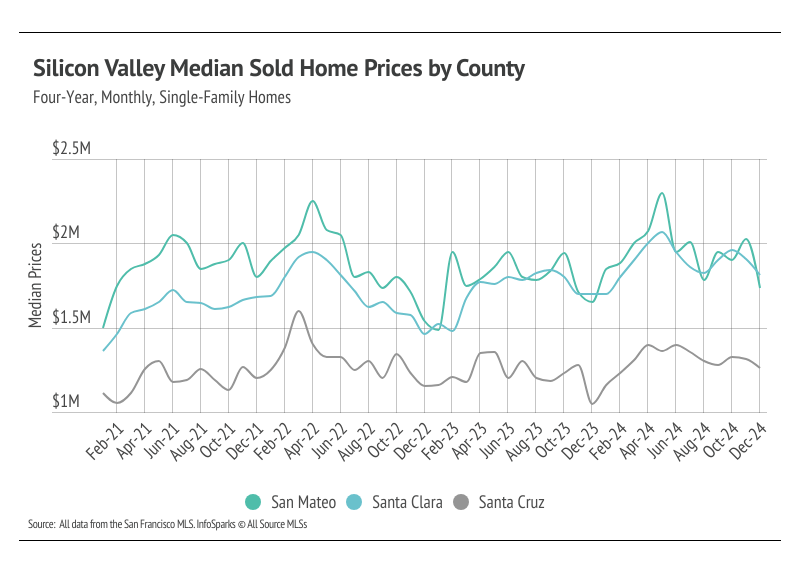
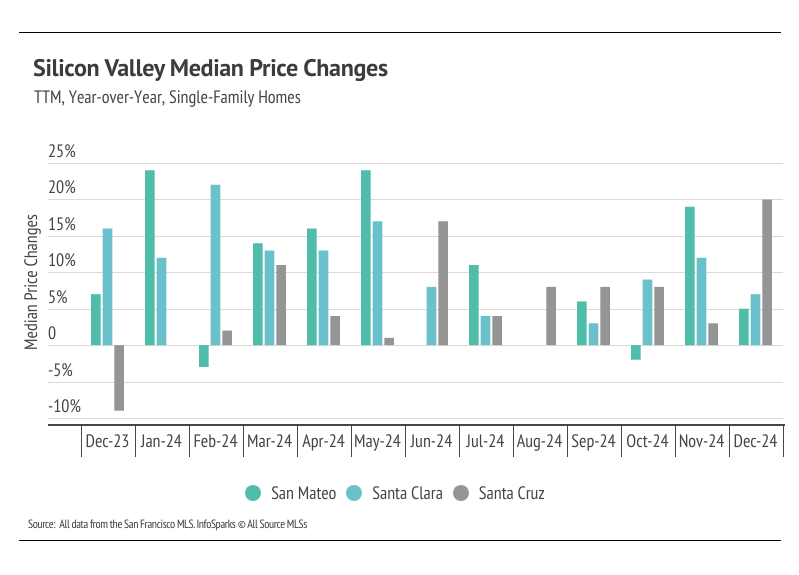
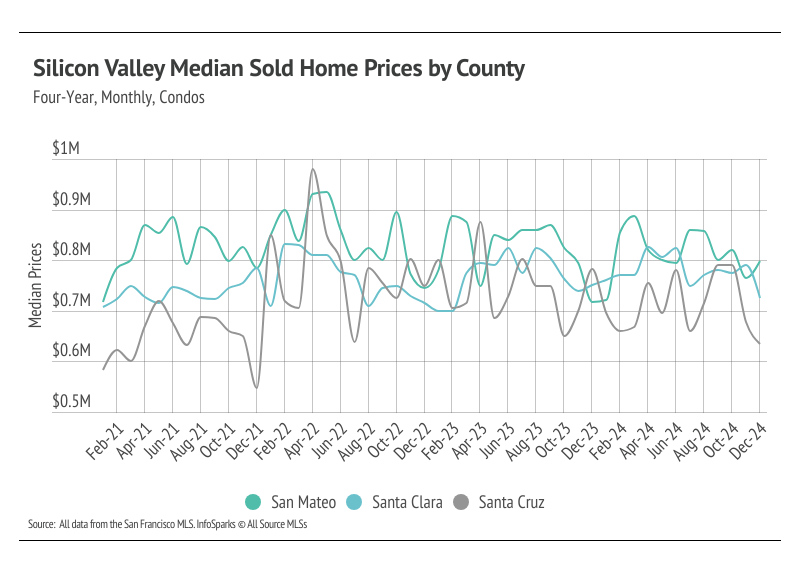
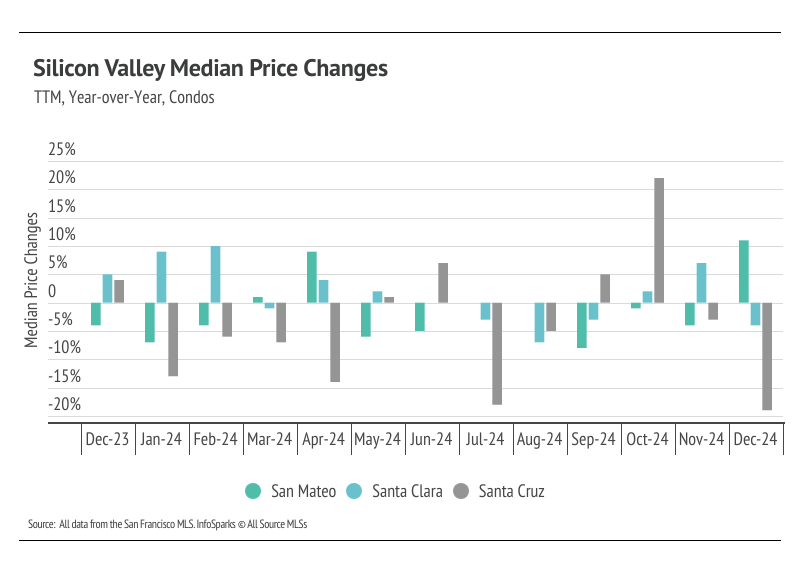
  • Median single-family home prices rose in 2024, following historical seasonal trends. Single-family home prices in Santa Cruz saw the largest gain, up 20%. Conversely, Santa Cruz condo prices experienced the largest contraction, down 18%.
  • Total inventory fell 36.9% month over month, dropping inventory to a record low. We expect inventory to continue to decline in January and the overall market to slow due to lack of supply.
  • Months of Supply Inventory indicated a sellers’ market for single-family homes and condos with the exception of Santa Cruz condos, which is more balanced.

THE MEDIAN SINLE-FAMILY HOME PRICES ARE UP YEAR OVER YEAR

In Silicon Valley, home prices haven’t been largely affected by rising mortgage rates after the initial period of price correction from April 2022 to January 2023. Low, but growing inventory and high demand have more than offset the downward price pressure from higher mortgage rates. Year over year, single-family home prices increased 5% in San Mateo, 7% in Santa Clara, and 20% in Santa Cruz. Prices typically peak in the summer months, and the mild contraction after the post-summer peak has fallen in line with expectations. Home prices in Santa Clara may reach new all-time highs in 2025, but it’s unlikely that San Mateo and Santa Cruz will.
 
High mortgage rates soften both supply and demand, but homebuyers and sellers seemed to tolerate rates near 6% much more than around 7%. Mortgage rates fell significantly from May through September, but rose significantly in the fourth quarter of 2024. Now, rates are far closer to 7% than 6%, so we expect sales to slow further.
 
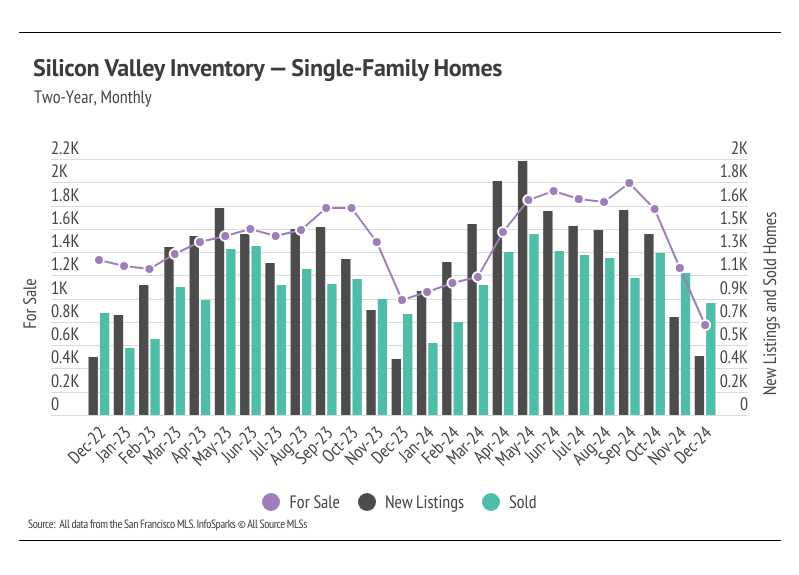
Sales far outpaced new listings in December, dropping inventory to all-time lows
  • 2024 Highlights: Inventory built steadily through the first nine months but dropped sharply in Q4, with Silicon Valley hitting record lows in December.
  • 2023 Overview: Inventory followed typical seasonal trends but at much lower levels, with fewer new listings slowing the market.
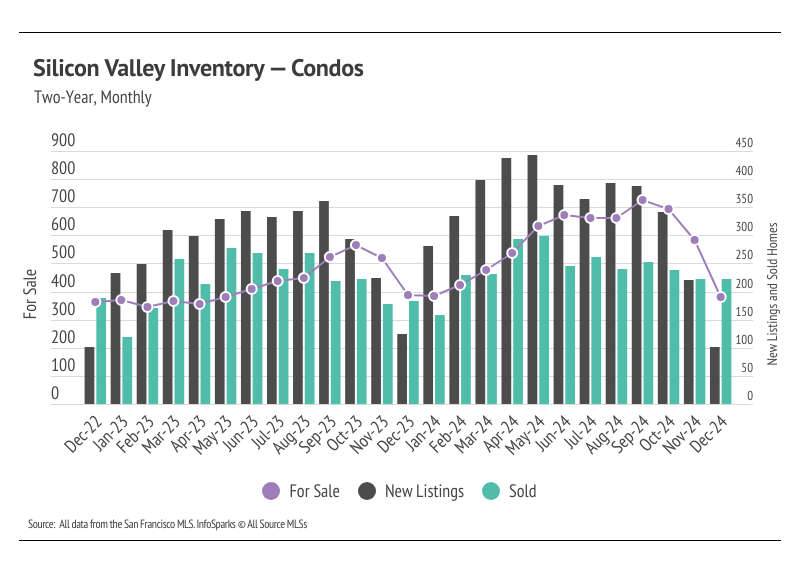
  • Condo Market: Inventory peaked at a four-year high in September 2024 before declining in Q4.
  • Single-Family Homes: Inventory fell 20% year-over-year due to a 60% decline in Q4 as new listings dropped faster than sales.
  • Seasonal Outlook for 2024: Inventory, sales, and listings are expected to follow traditional patterns, though single-family home inventory remains near record lows.

MONTHS OF SUPPLY INVENTORY INDICATED A SELLER'S MARLET IN DECEMBER 

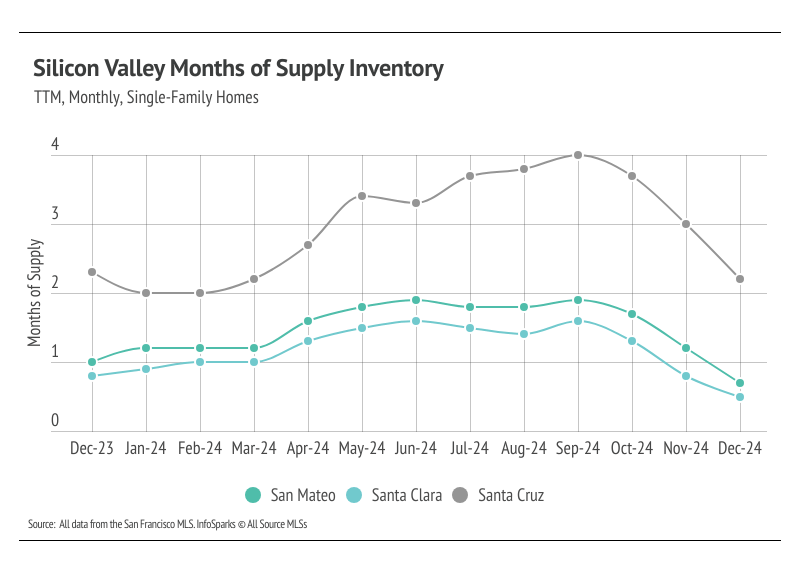
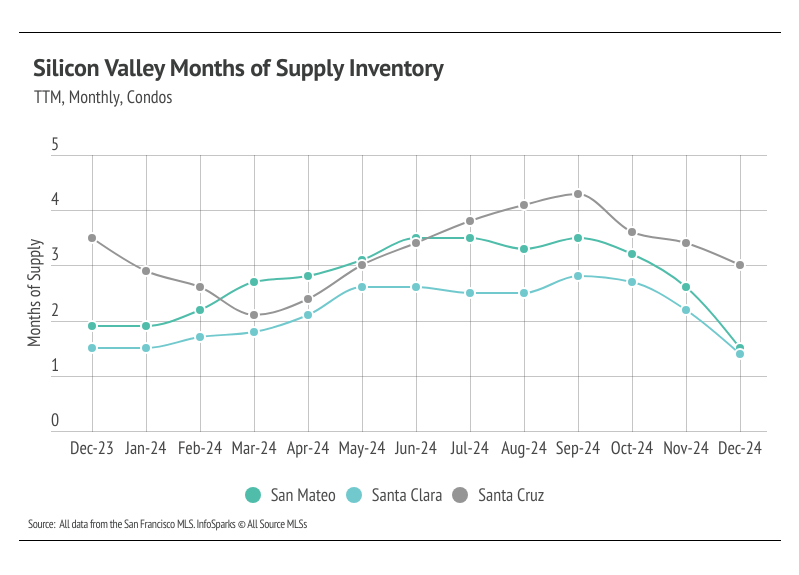
Months of Supply Inventory (MSI) quantifies the supply/demand relationship by measuring how many months it would take for all current homes listed on the market to sell at the current rate of sales. The long-term average MSI is around three months in California, which indicates a balanced market. An MSI lower than three indicates that there are more buyers than sellers on the market (meaning it’s a sellers’ market), while a higher MSI indicates there are more sellers than buyers (meaning it’s a buyers’ market). The Silicon Valley market tends to favor sellers, which is reflected in its low MSI. In 2024, Silicon Valley MSI moved higher, particularly in Q2. In Q4, MSI dropped across markets. MSI indicated a sellers’ market for single-family homes and condos with the exception of the Santa Cruz condo market, which is more balanced.

LOCAL LOWDOWN DATA

Line chart comparing monthly median sold home prices in San Mateo, Santa Clara, and Santa Cruz counties, 2021–2024.

Bar chart comparing year-over-year single-family home median price changes in San Mateo, Santa Clara, and Santa Cruz counties.

Chart of monthly Silicon Valley condo median prices by county, February 2021–December 2024.

Bar chart comparing year-over-year condo median price changes across three counties, December 2023 to December 2024.

Silicon Valley single-family home inventory chart, December 2022–December 2024.

Silicon Valley condo market chart comparing homes for sale, new listings, and sold homes from December 2022 to December 2024.

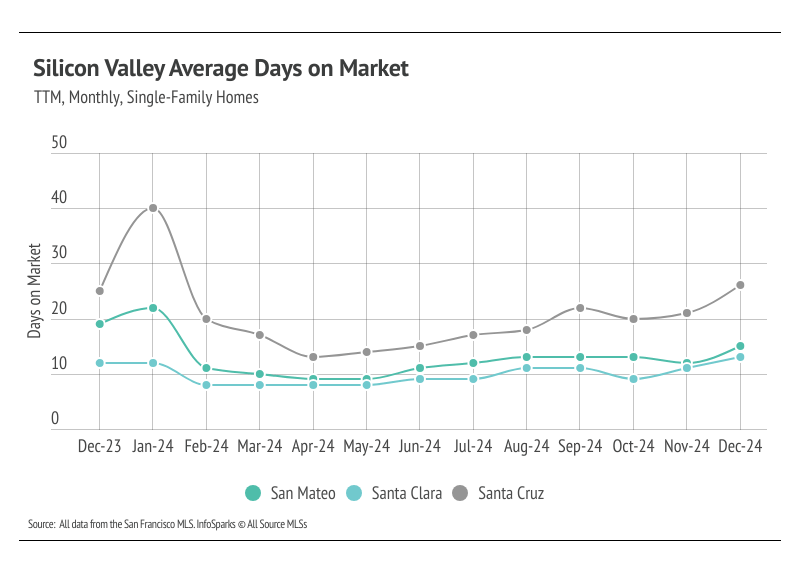
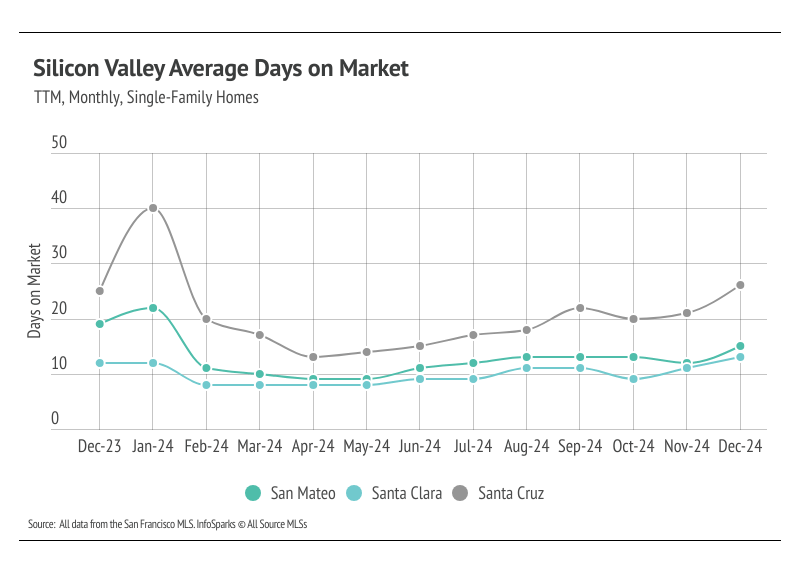
Line chart comparing average days on market for single-family homes in San Mateo, Santa Clara, and Santa Cruz counties.Line chart comparing monthly days on market for single-family homes in San Mateo, Santa Clara, and Santa Cruz during 2024.

Chart of Silicon Valley months of supply inventory by county, December 2023 to December 2024.

Line chart of monthly housing supply across San Mateo, Santa Clara, and Santa Cruz, December 2023–December 2024.

CLINK LINKS and FOLLOW US for more updates!
 
Visit our Page: Milestone Realty - Buy & Sell in Greater Silicon Valley, Almaden & Willow Glen (remilestone.com)


Let's Talk

You’ve got questions and we can’t wait to answer them.
Set Up Your Search for New Homes

Check It Out