June '24 Market Update

Market Update

June '24 Market Update

JUNE '24 MARKET UPDATE

Record high median home prices once again
 
Quick Take:
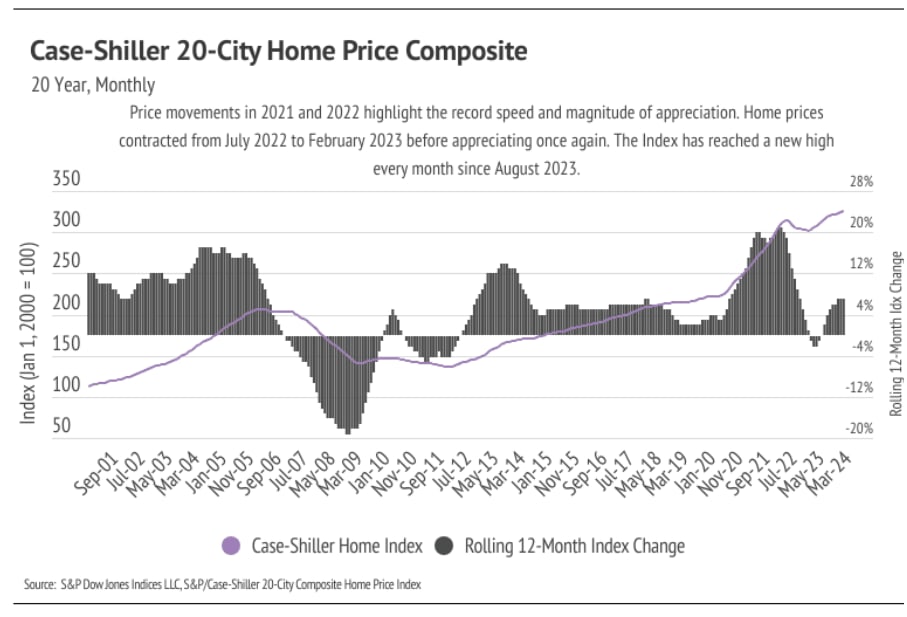
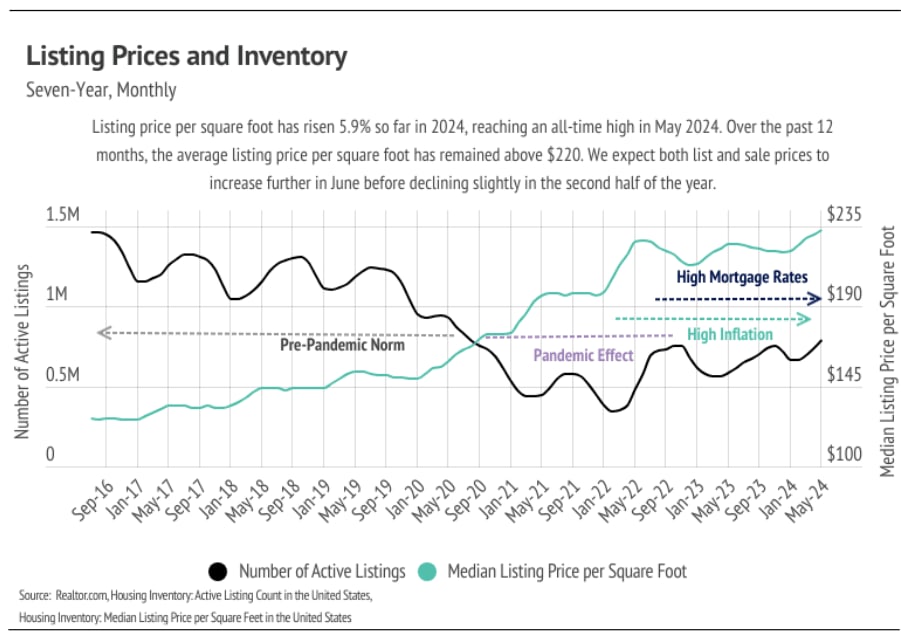
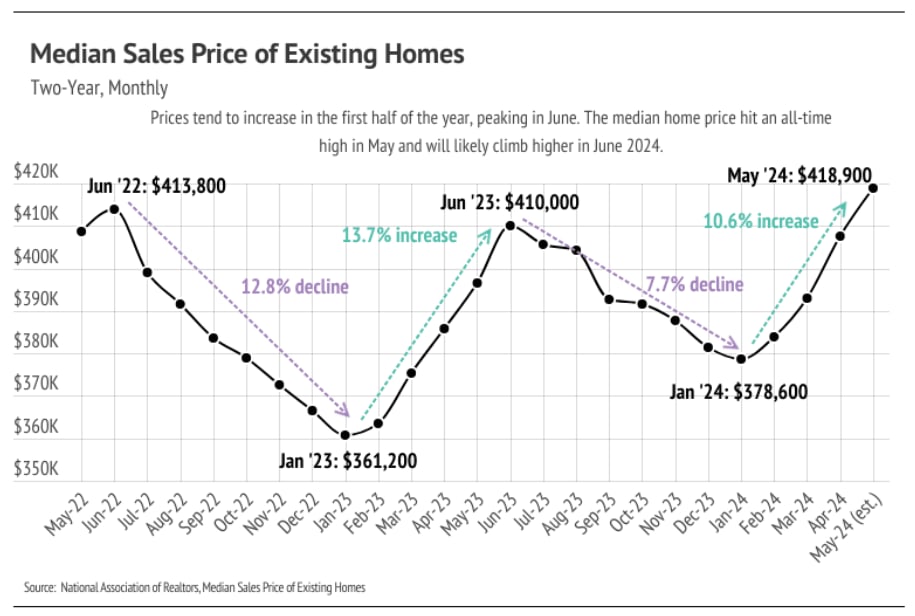
  • Since January 2024, prices have climbed 10.6%, reaching an all-time high in May 2024. Similarly, the median list price per square foot hit an all-time high in April and again in May 2024. Affordability for homes has reached a record low.
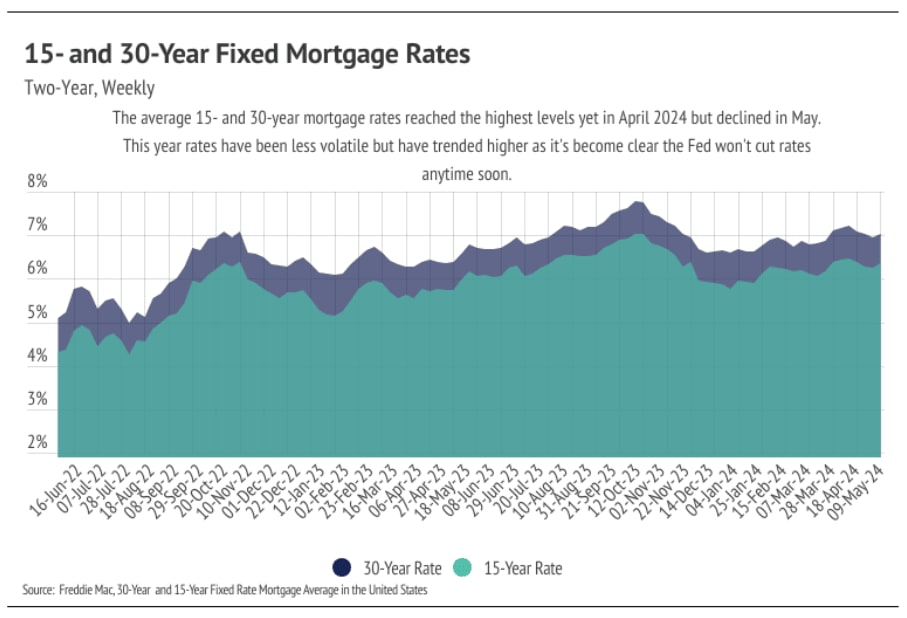
  • In May, the average 30-year mortgage rate fell to 7.03%, dropping 0.19% from the 2024 high reached in April. The Fed has expressed hesitation around lowering rates due to higher-than-desired inflation. Currently, we expect rates to remain between 6% and 8% for the rest of 2024.
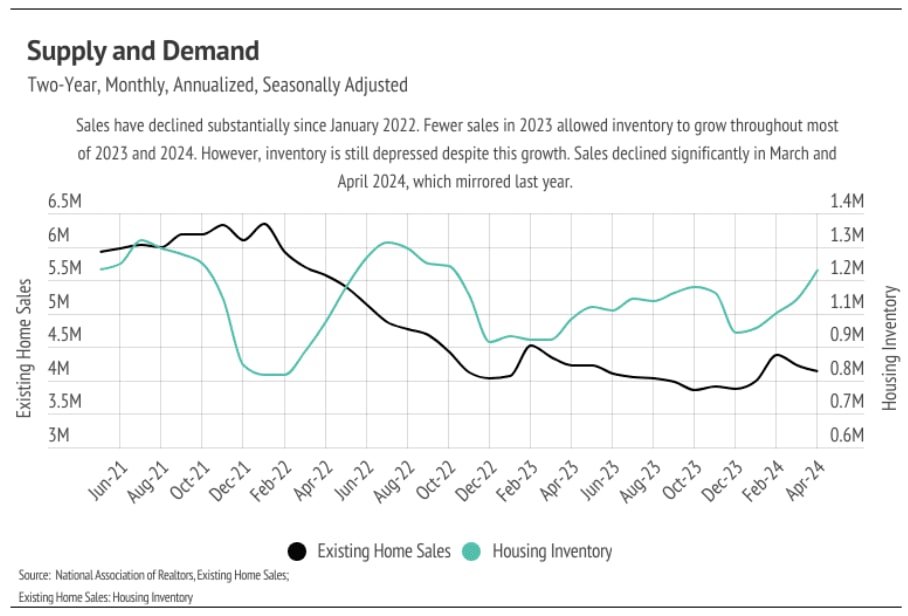
  • Sales fell 1.9% month over month, while inventory rose 9.0%. The combination of rising prices and high interest rates has continued to price more buyers out of the market, slowing sales.

Home prices rose 5.6% to $418,900, the highest ever, with demand still strong despite high mortgage rates. Inventory is at its highest since August 2020, which may slow price increases. The Fed held rates steady, with rate hikes unlikely. For local insights, see the Local Lowdown.

BIG STORY DATA

Chart of existing-home median sales prices, showing a May 2024 estimate of $418,900 and recent price trends.

Case-Shiller 20-City home price chart showing index and annual changes, 2001–2024.

Chart comparing weekly 15- and 30-year U.S. mortgage rates from June 2022 to May 2024.

Line chart of U.S. listing prices and active inventory from 2016 to 2024, with pandemic and inflation annotations.

Line chart of existing home sales and housing inventory from June 2021 through April 2024.

THE LOCAL LOWDOWN

Quick Take:
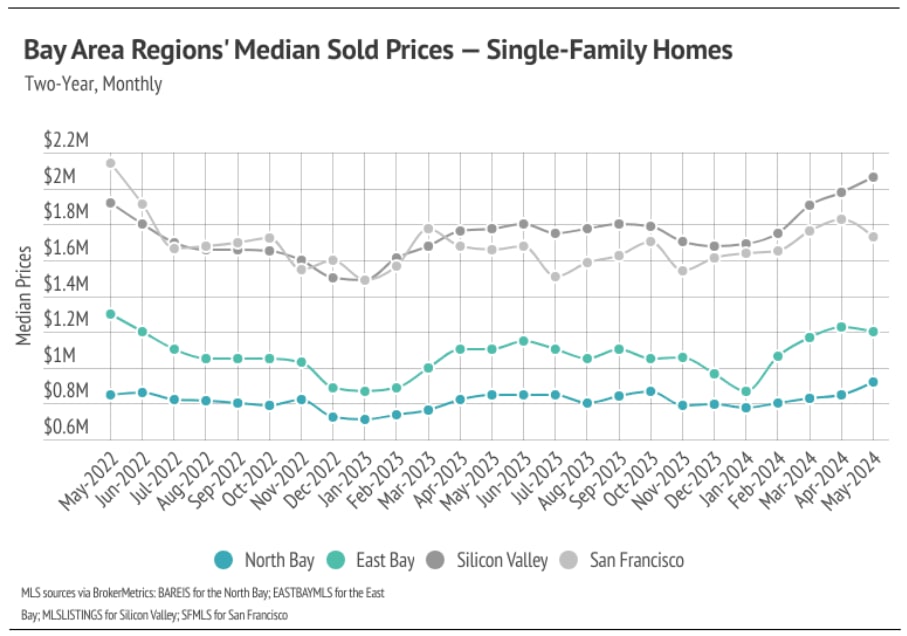
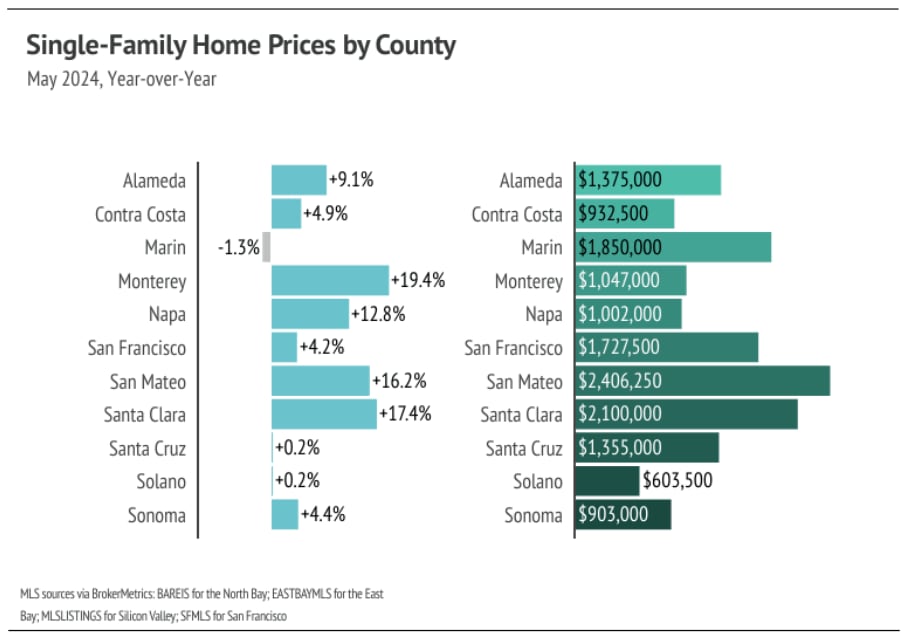
  • The median single-family home prices in San Mateo, Santa Clara, and Sonoma reached record highs in May. As more new listings come to market, we expect prices to continue rising and to reach new highs during the summer months.
  • Active listings, sales, and new listings rose across most of the Bay Area month over month, which are all beneficial for the housing market. We expect inventory to increase into the summer and return to a more normal market after the slowdown experienced over the past year and a half.
  • Months of Supply Inventory has declined sharply in 2024, indicating that buyer competition is ramping up. MSI implies a sellers’ market in most of the Bay Area.

 In May, median single-family home prices hit record highs in San Mateo, Santa Clara, and Sonoma, with overall Bay Area prices near all-time highs, while high mortgage rates and low inventory continue to drive prices up, potentially slowing sales later this year.

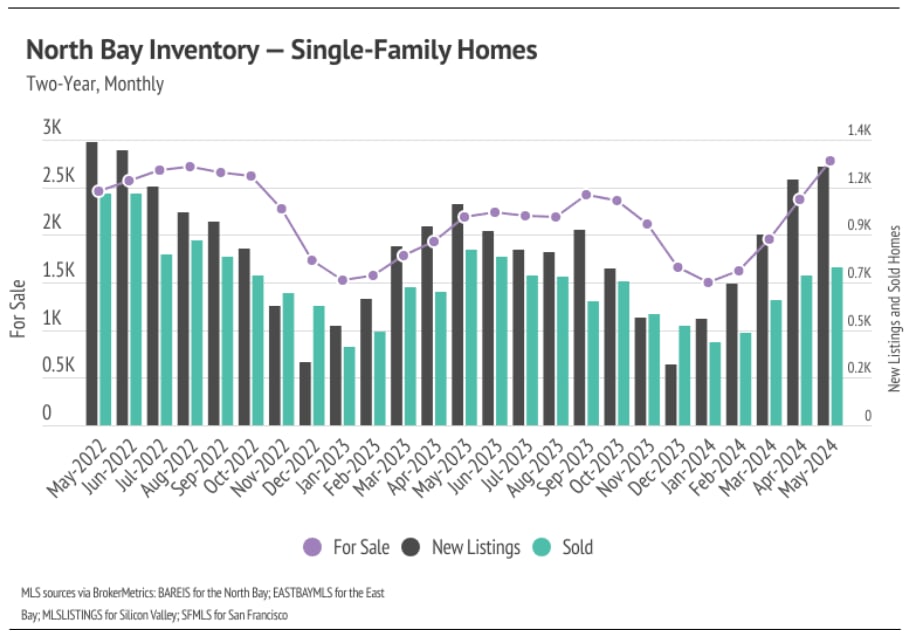
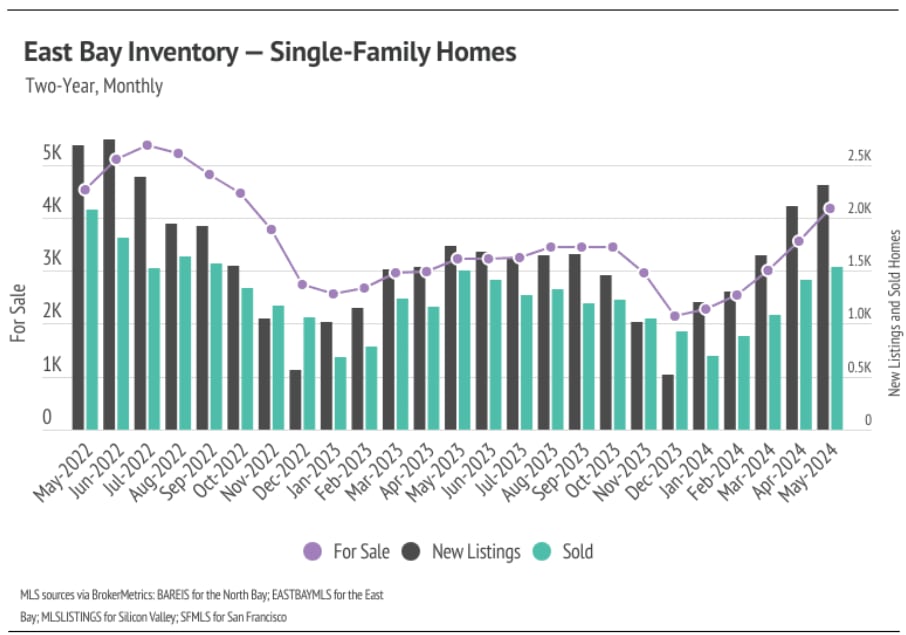
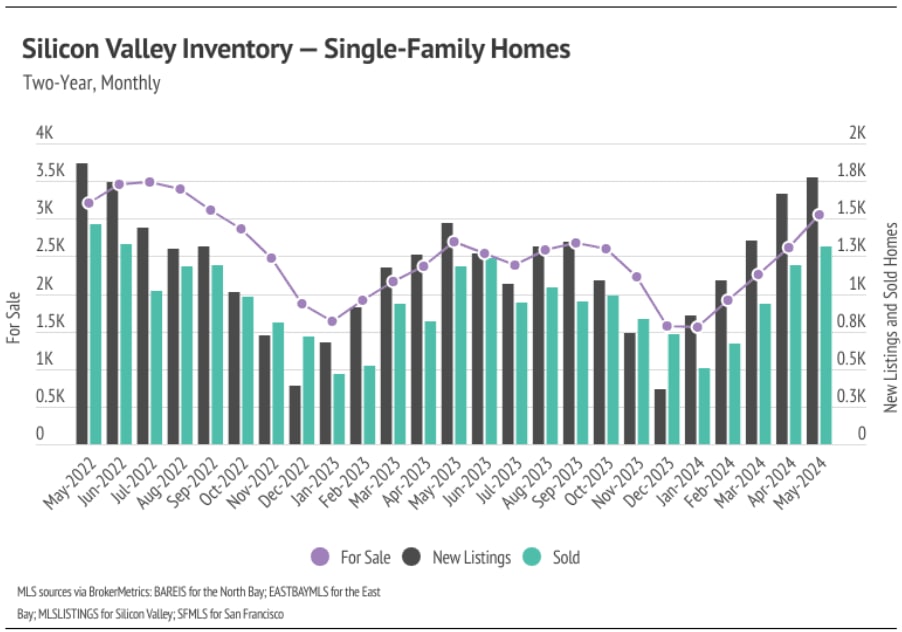
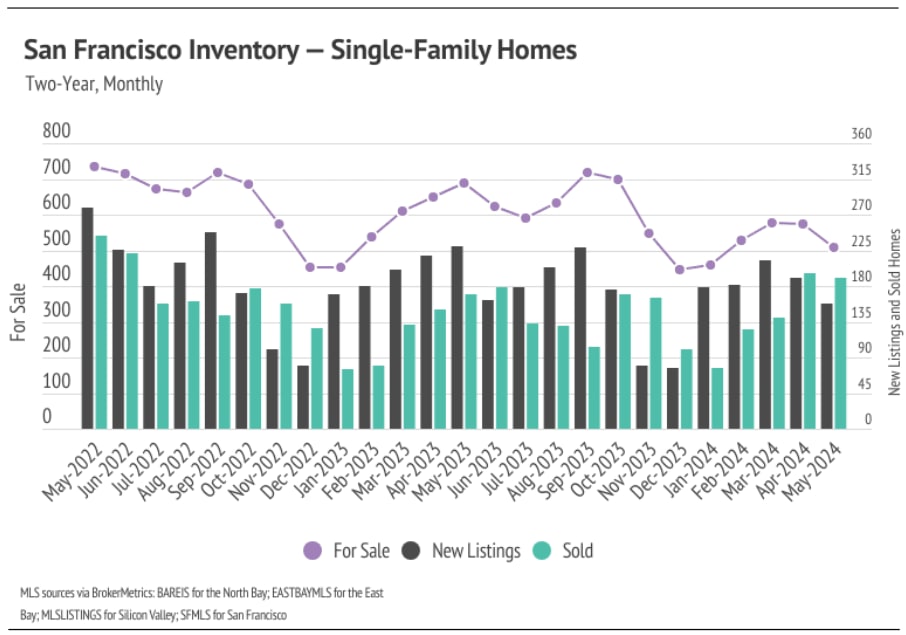
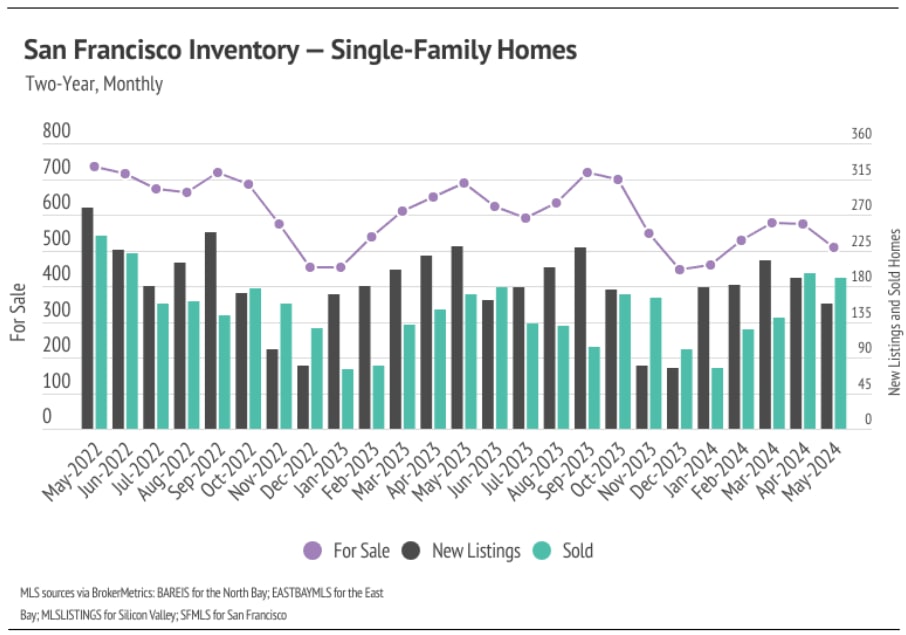
In 2024, single-family home inventory, sales, and new listings in the Bay Area have increased significantly month-over-month, driven by more new listings, resulting in healthier market conditions except in San Francisco.

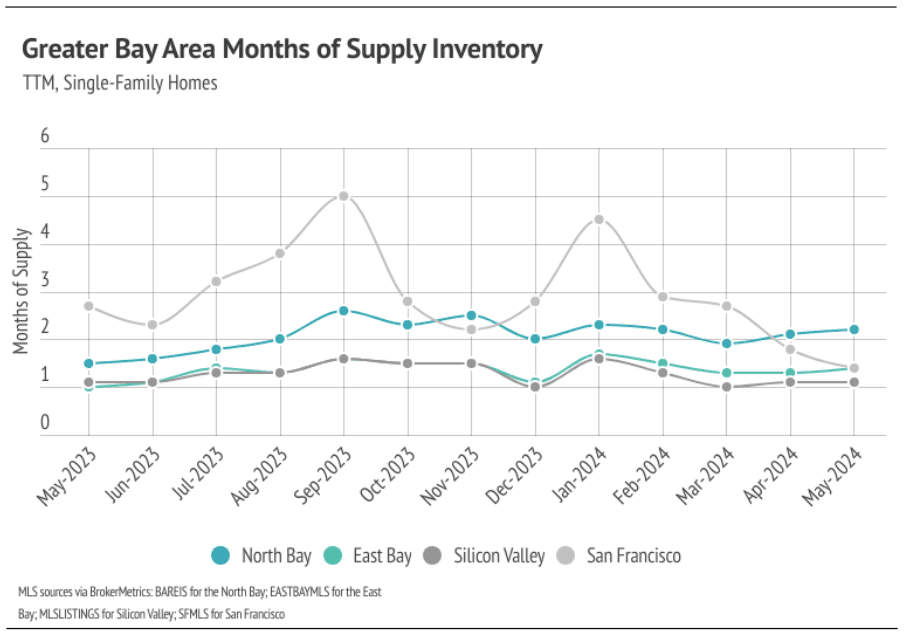
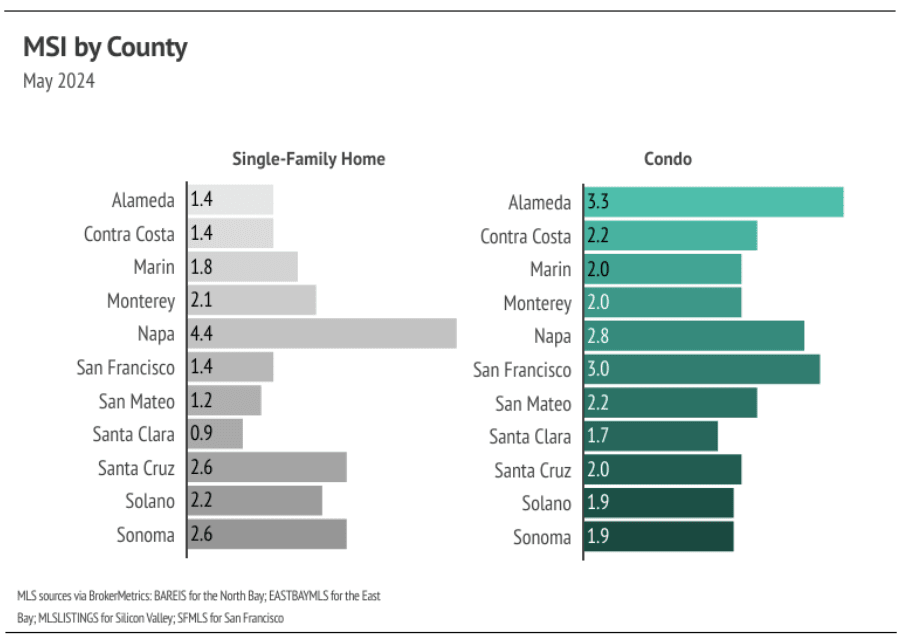
In May 2024, the Months of Supply Inventory (MSI) fell, indicating a sellers' market across the Bay Area, with MSI below three months in most counties. Exceptions include single-family homes in Napa (buyers' market) and condos in Alameda and San Francisco (balanced markets). San Francisco's MSI has been notably variable over the past year.


Line chart comparing monthly median single-family home prices in four Bay Area regions, May 2022–May 2024.

May 2024 home price changes and prices by Bay Area county.

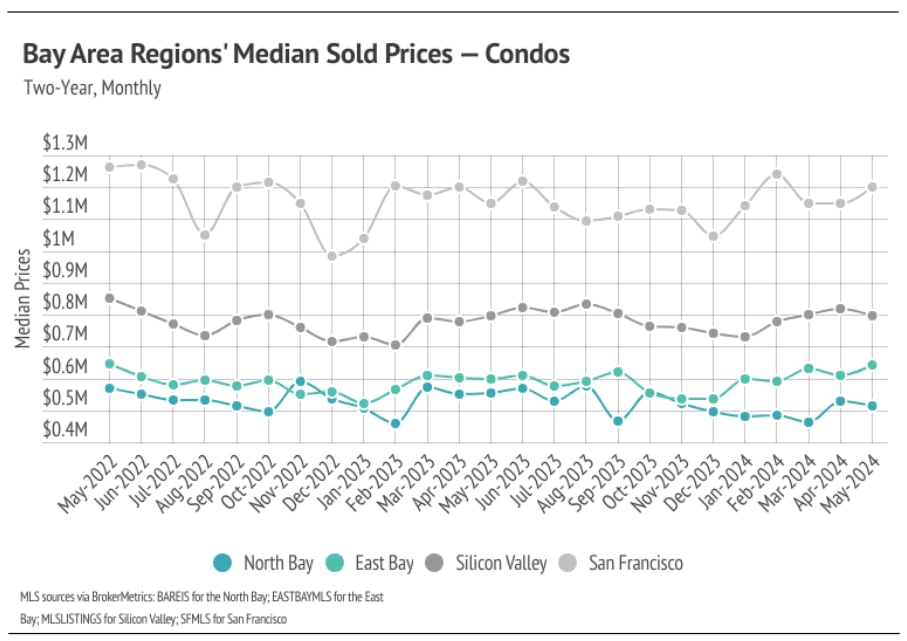
Line chart comparing monthly median condo prices in four Bay Area regions from May 2022 to May 2024.

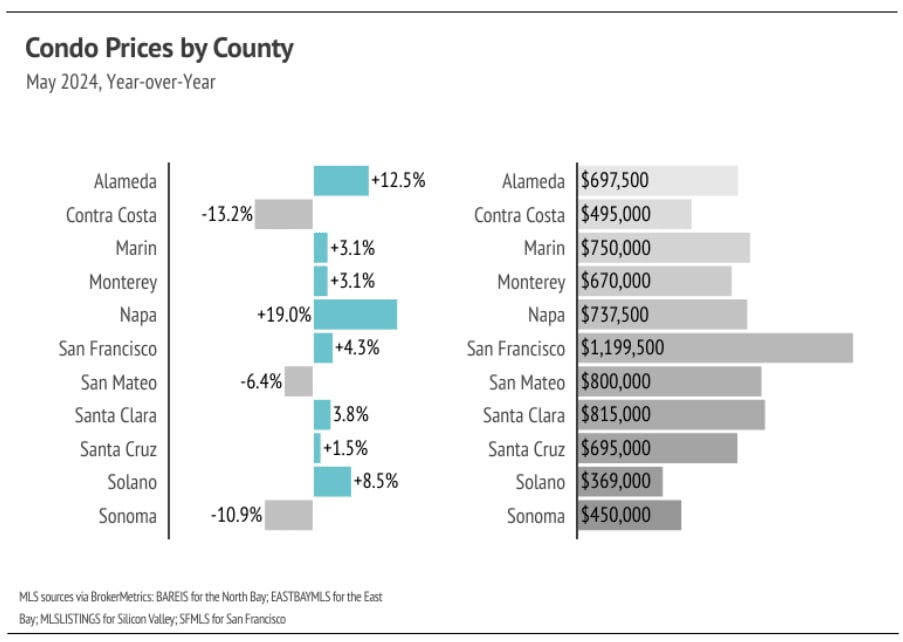
Chart of May 2024 condo prices and year-over-year changes across 11 Bay Area counties.

North Bay single-family home inventory chart comparing homes for sale, new listings, and sales from May 2022 to May 2024.

Chart of East Bay single-family homes for sale, newly listed, and sold from May 2022 to May 2024.

Chart of Silicon Valley single-family home inventory, new listings, and sales from May 2022 to May 2024.

Chart of San Francisco single-family home inventory, new listings, and sales from May 2022 to May 2024.

Chart of San Francisco single-family home inventory, new listings, and sales from May 2022 to May 2024.

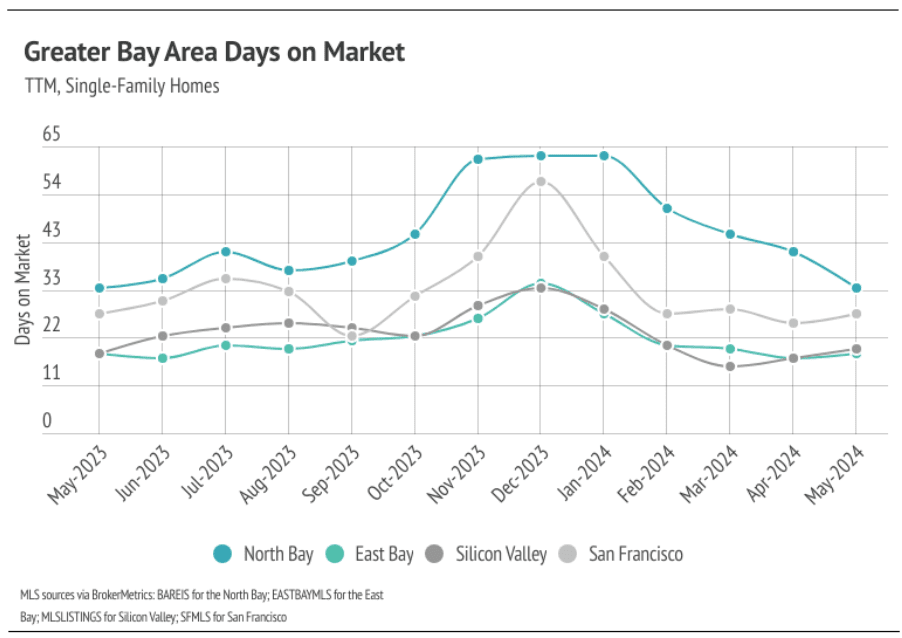
Line chart comparing days on market across four Greater Bay Area regions from May 2023 to May 2024.

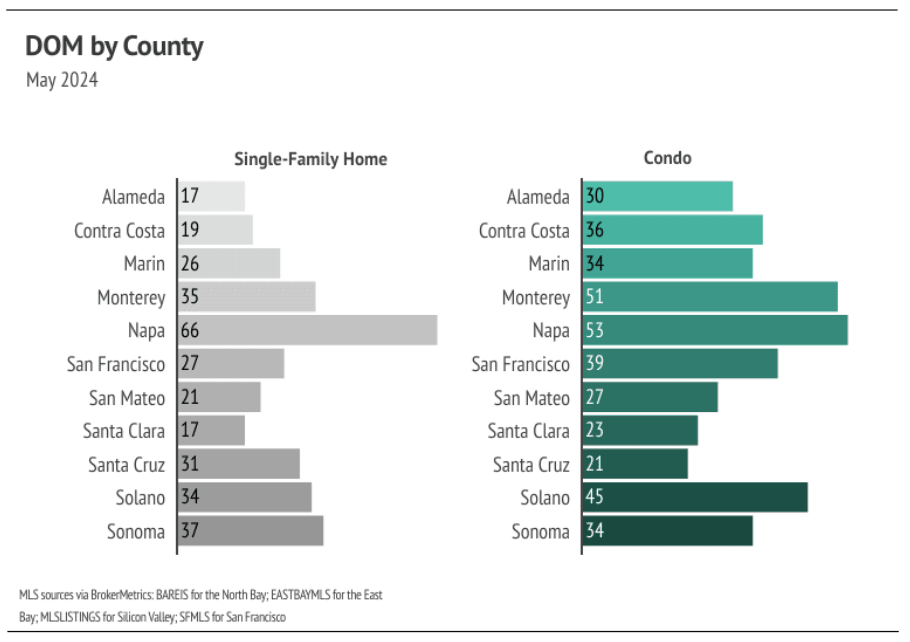
May 2024 days-on-market chart by county, comparing single-family homes and condos; Napa has the highest values.

Line chart comparing months of single-family home supply across four Greater Bay Area regions, May 2023–May 2024.

May 2024 months-of-supply chart by county for single-family homes and condos.


CLINK LINKS and FOLLOW US for more updates!
 
Visit our Page: Milestone Realty - Buy & Sell in Greater Silicon Valley, Almaden & Willow Glen (remilestone.com)


Let's Talk

You’ve got questions and we can’t wait to answer them.
Set Up Your Search for New Homes

Check It Out