July '25 Market Update
Greater Bay Area Market Update
Quick Take:
  • Although affordability has been improving over the past few months, monthly P&I payments are still quite a bit higher than they were last year.
  • Despite political moves that some believe were designed to bring down interest rates, mortgage rates remain high, as the lending market prices in future uncertainty.
  • On a national level, inventories are increasing at a very rapid rate, while the number of homes sold has declined.
  • Over the past couple of months, the macroeconomic environment has been incredibly unpredictable, a trend which looks like it will continue over the coming months.

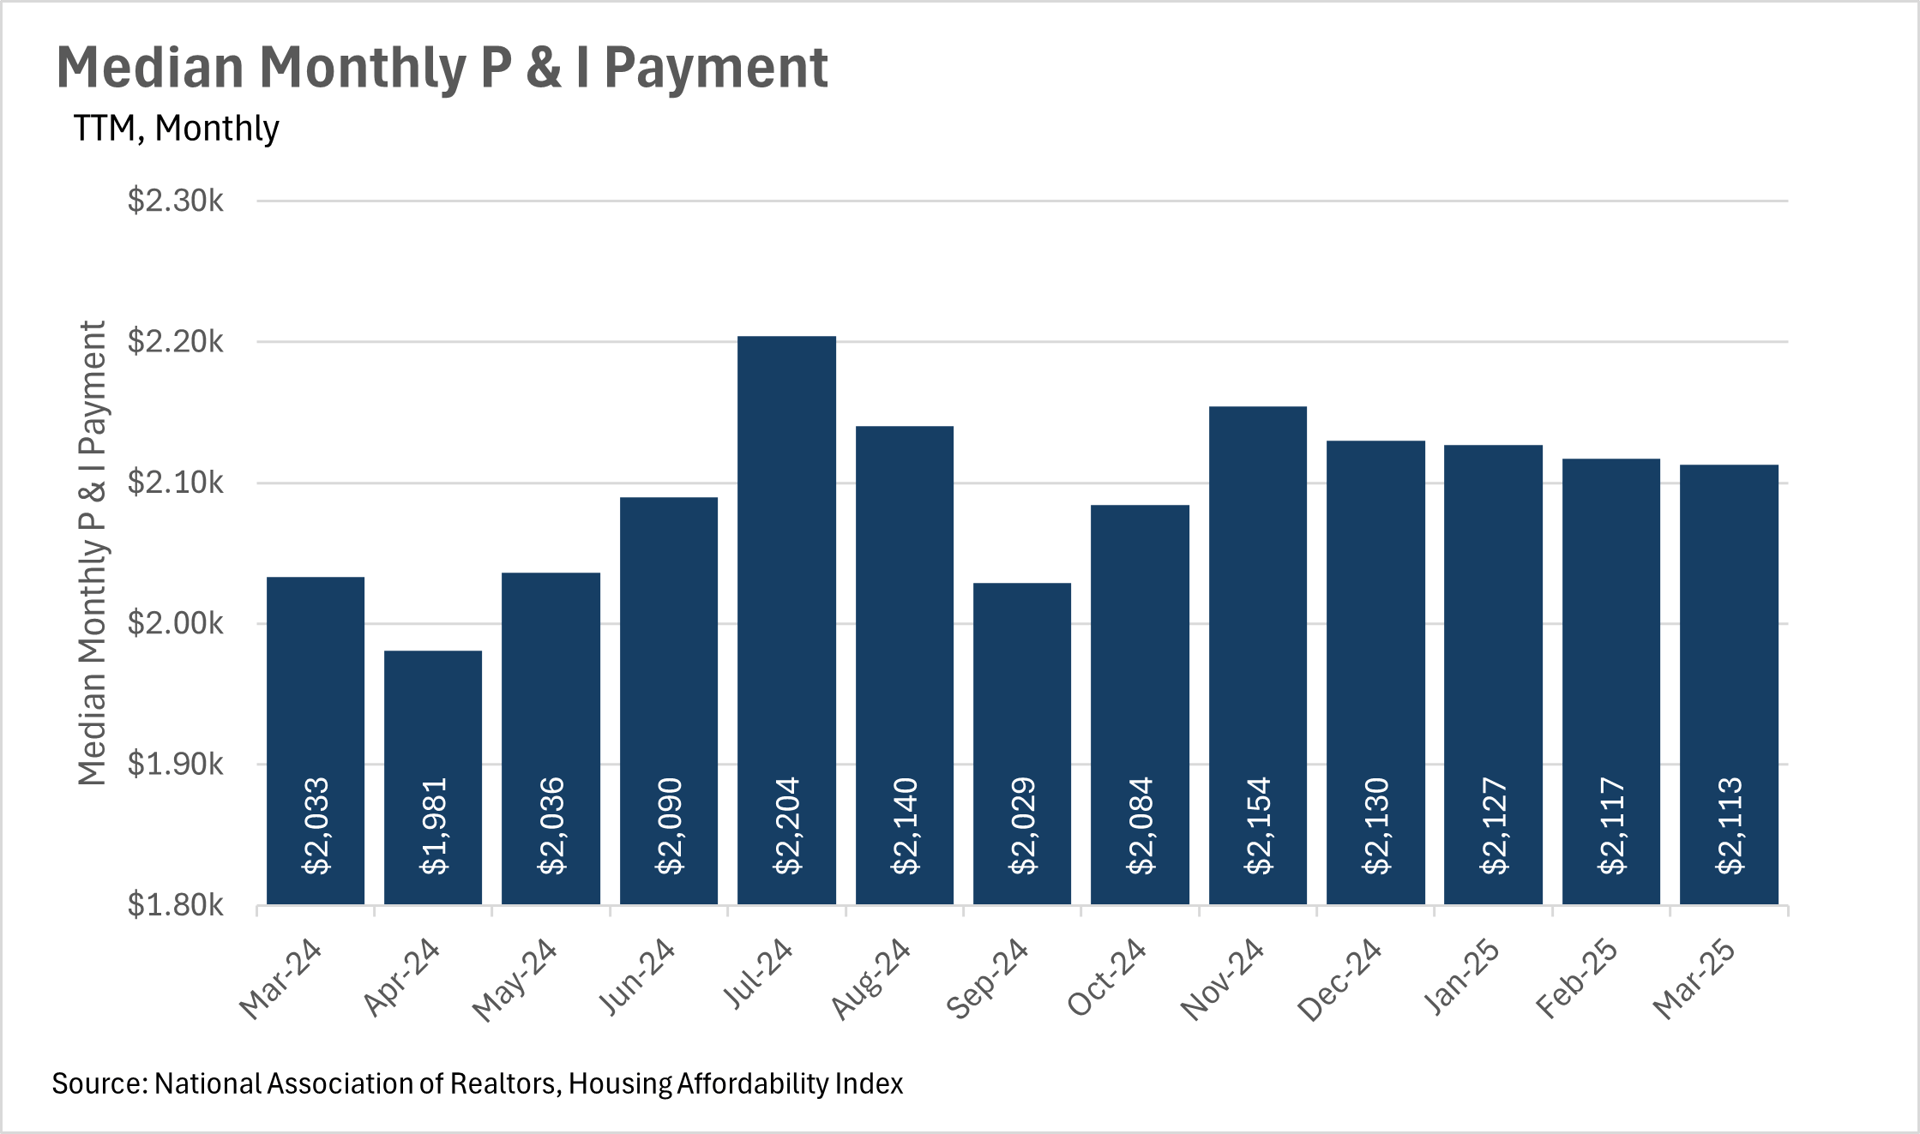
Even as inflation appears to be under control, housing-related costs continue to rise. The median monthly principal and interest (P&I) payment is now $2,113, a 3.94% increase year-over-year—outpacing broader inflation, which remains in the 2–3% range. This indicates that inflationary pressures are still present in the housing sector, driven by both local supply constraints and ongoing buyer demand in many markets.

Mortgage rates are holding steady in the mid to high-6% range, with no major drops in sight unless the economy weakens significantly. Despite some speculation, the Federal Reserve has remained cautious. Most Fed officials forecast the federal funds rate to drop slightly, reaching around 3.75–4.00% by year-end, and 3.25–3.50% by 2026.

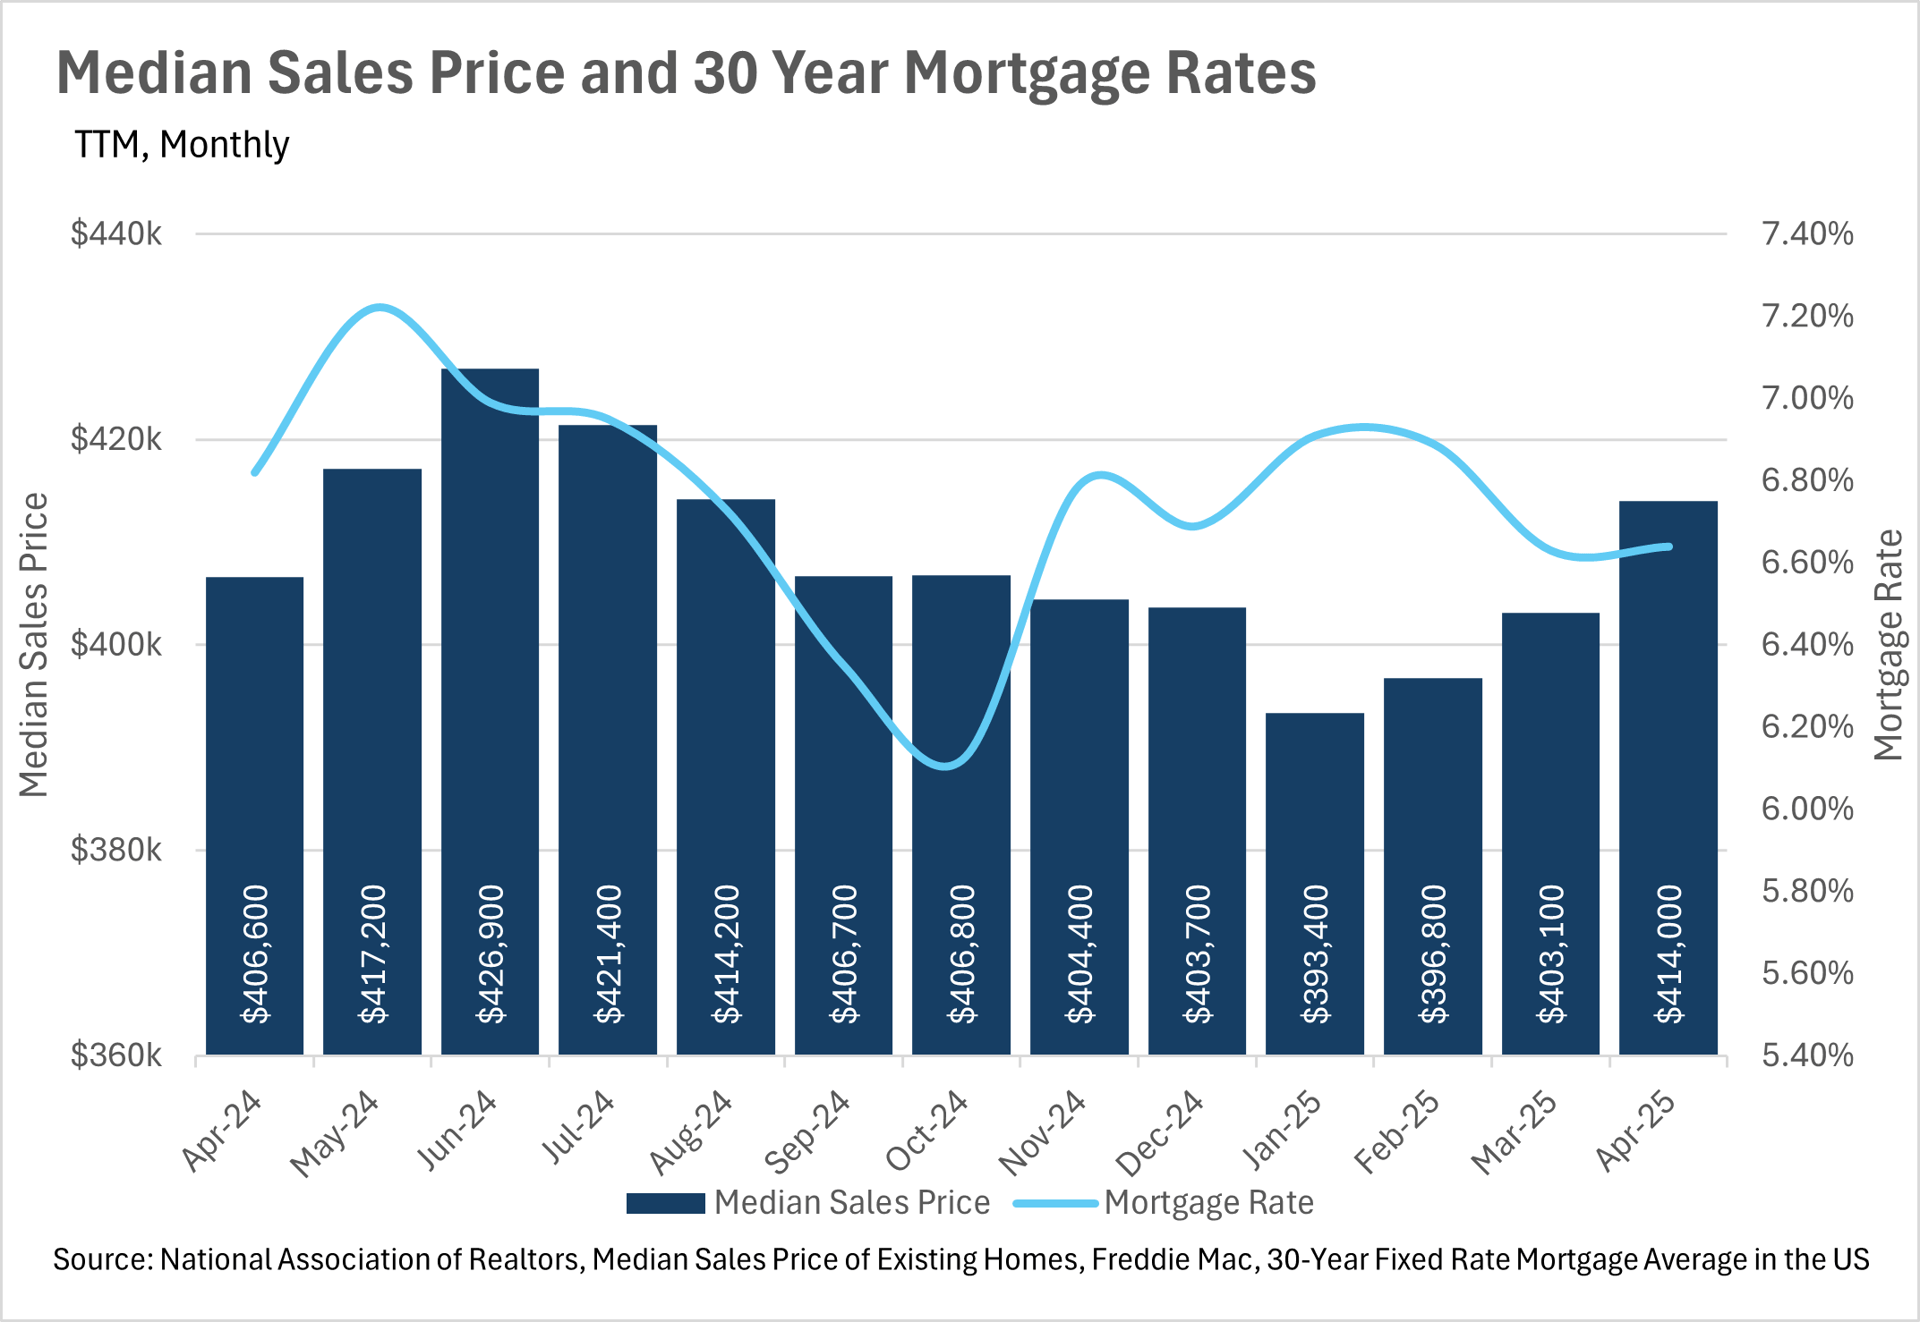
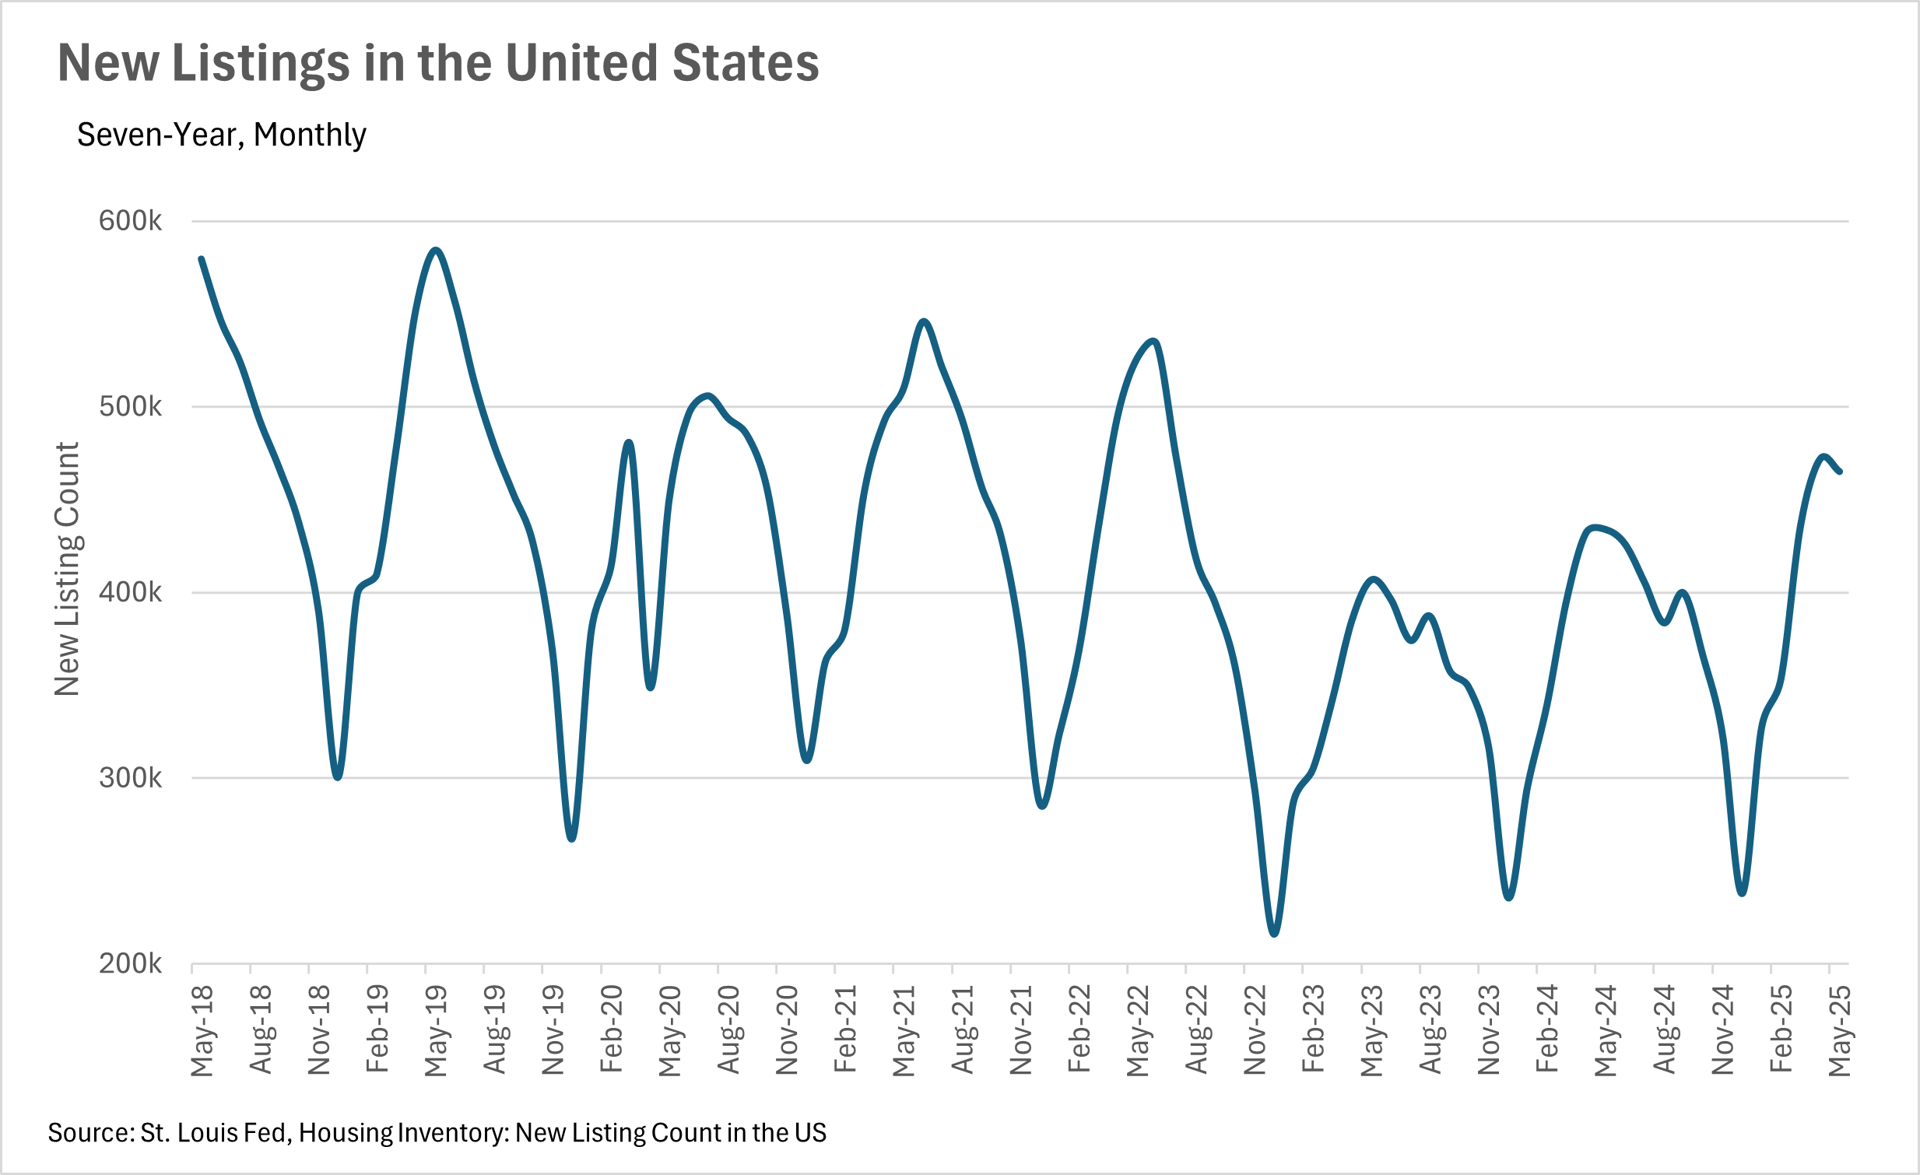
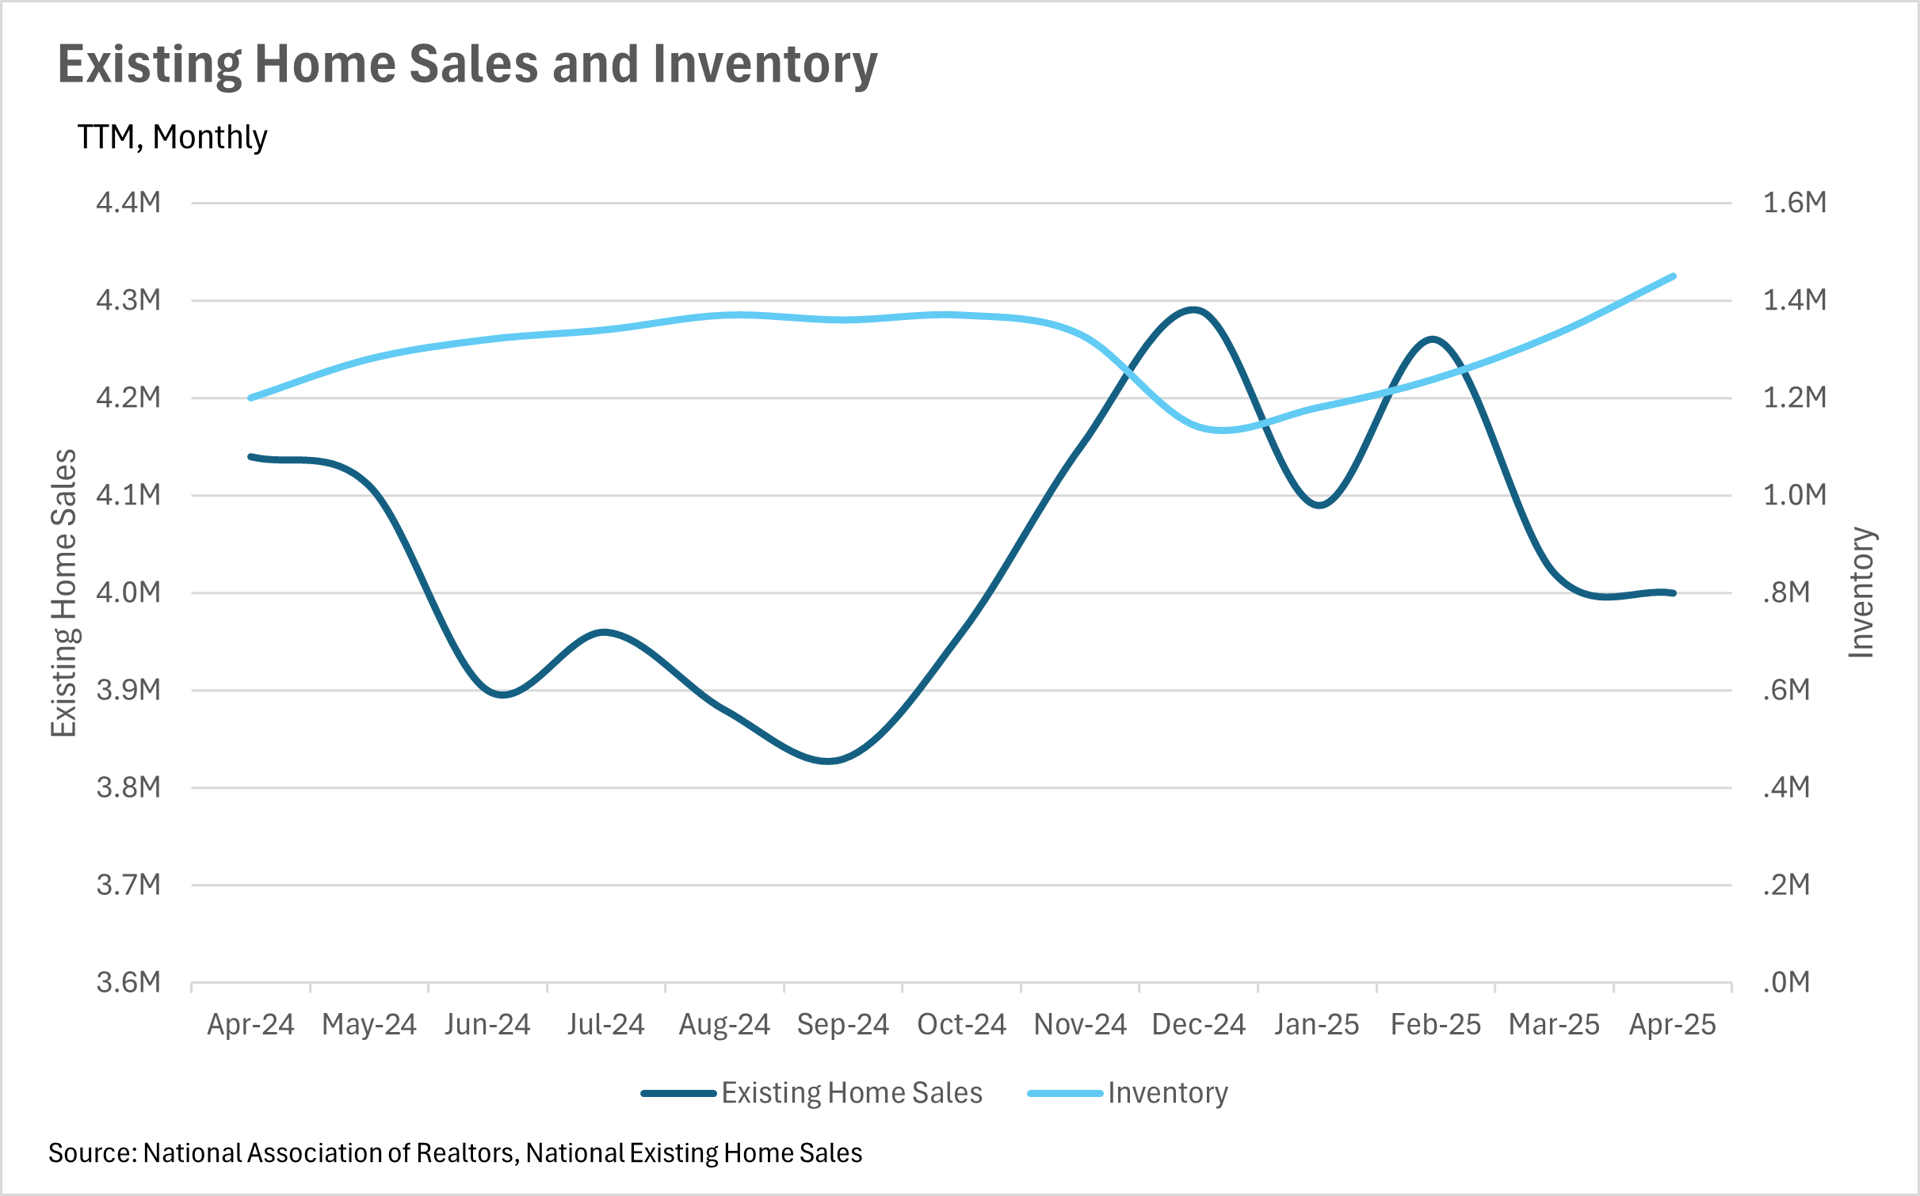
On a national level, housing inventory is growing, with a 20.83% increase year-over-year, now totaling 1.45 million homes. Meanwhile, existing home sales dropped 3.38% to 4 million. Interestingly, home prices are still climbing, with a median sale price of $414,000, up 1.82% year-over-year. And the number of new listings is rising too—up 7.19%compared to last year.

➡️ Bottom Line: We’re seeing shifting conditions on a national scale, but real estate is always local. Be sure to check out our Local Lowdown for insights on what’s happening in your own neighborhood—and how to stay ahead in this evolving market.

BIG STORY DATA

Line chart of existing home sales and inventory from April 2024 to April 2025; inventory rises while sales fluctuate.

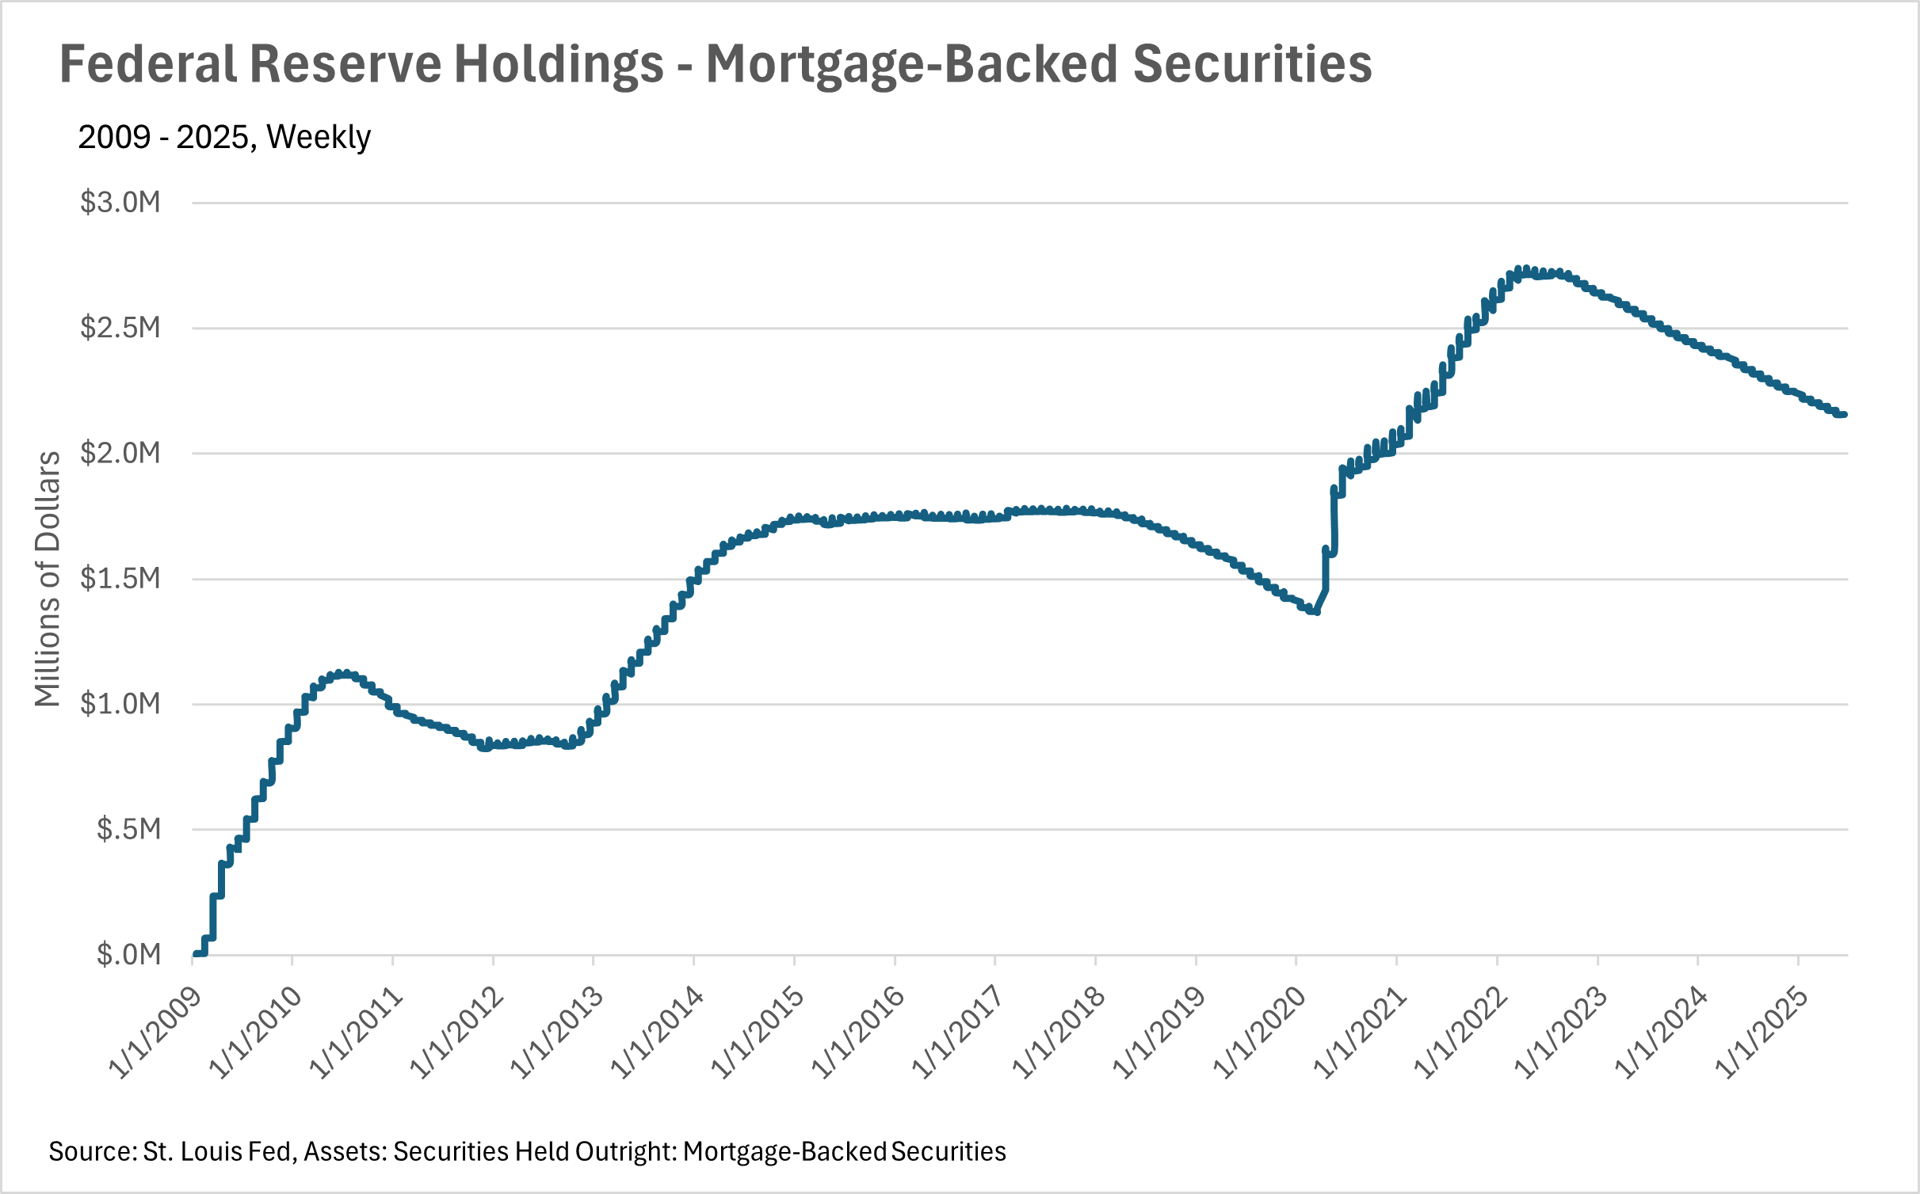
Line chart of Federal Reserve mortgage-backed securities holdings, 2009–2025, peaking in 2022 before declining.

Bar chart of median monthly principal and interest payments, peaking at $2,204 in July 2024 and ending at $2,113 in March 2025.

Chart of U.S. home prices and mortgage rates, April 2024–April 2025; prices fall through January, then rebound.

Line chart of monthly U.S. new listings from May 2018 to May 2025, with seasonal peaks and dips.

THE LOCAL LOWDOWN

Quick Take:
  • Bay Area real estate markets show stark contrasts in May, with San Francisco surging while Silicon Valley's growth streak breaks and North Bay prices decline.
  • Inventory dynamics vary dramatically across regions, East Bay and Silicon Valley see massive increases while San Francisco and North Bay experience sharp declines.
  • The region's housing markets are increasingly polarized, with single-family homes generally favoring sellers while condo markets present significant opportunities for buyers.
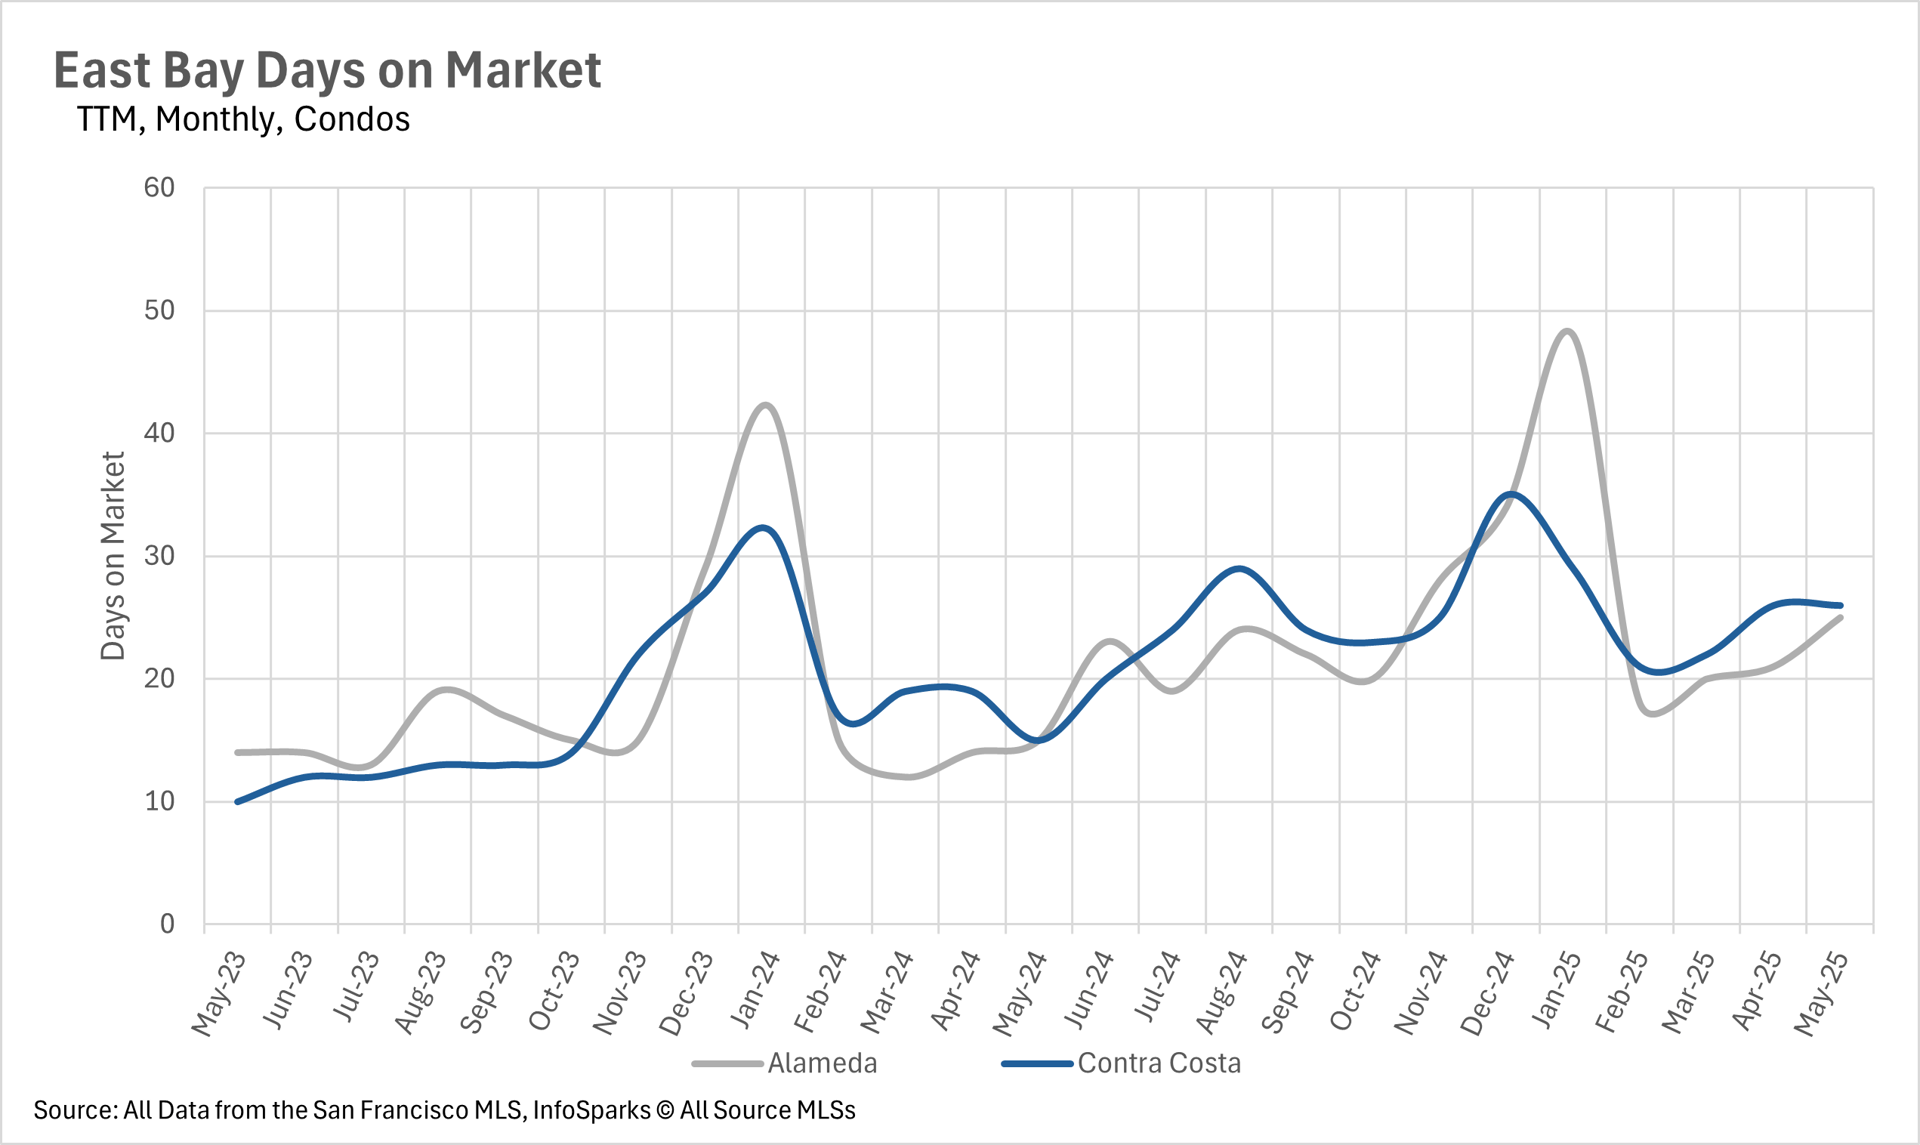
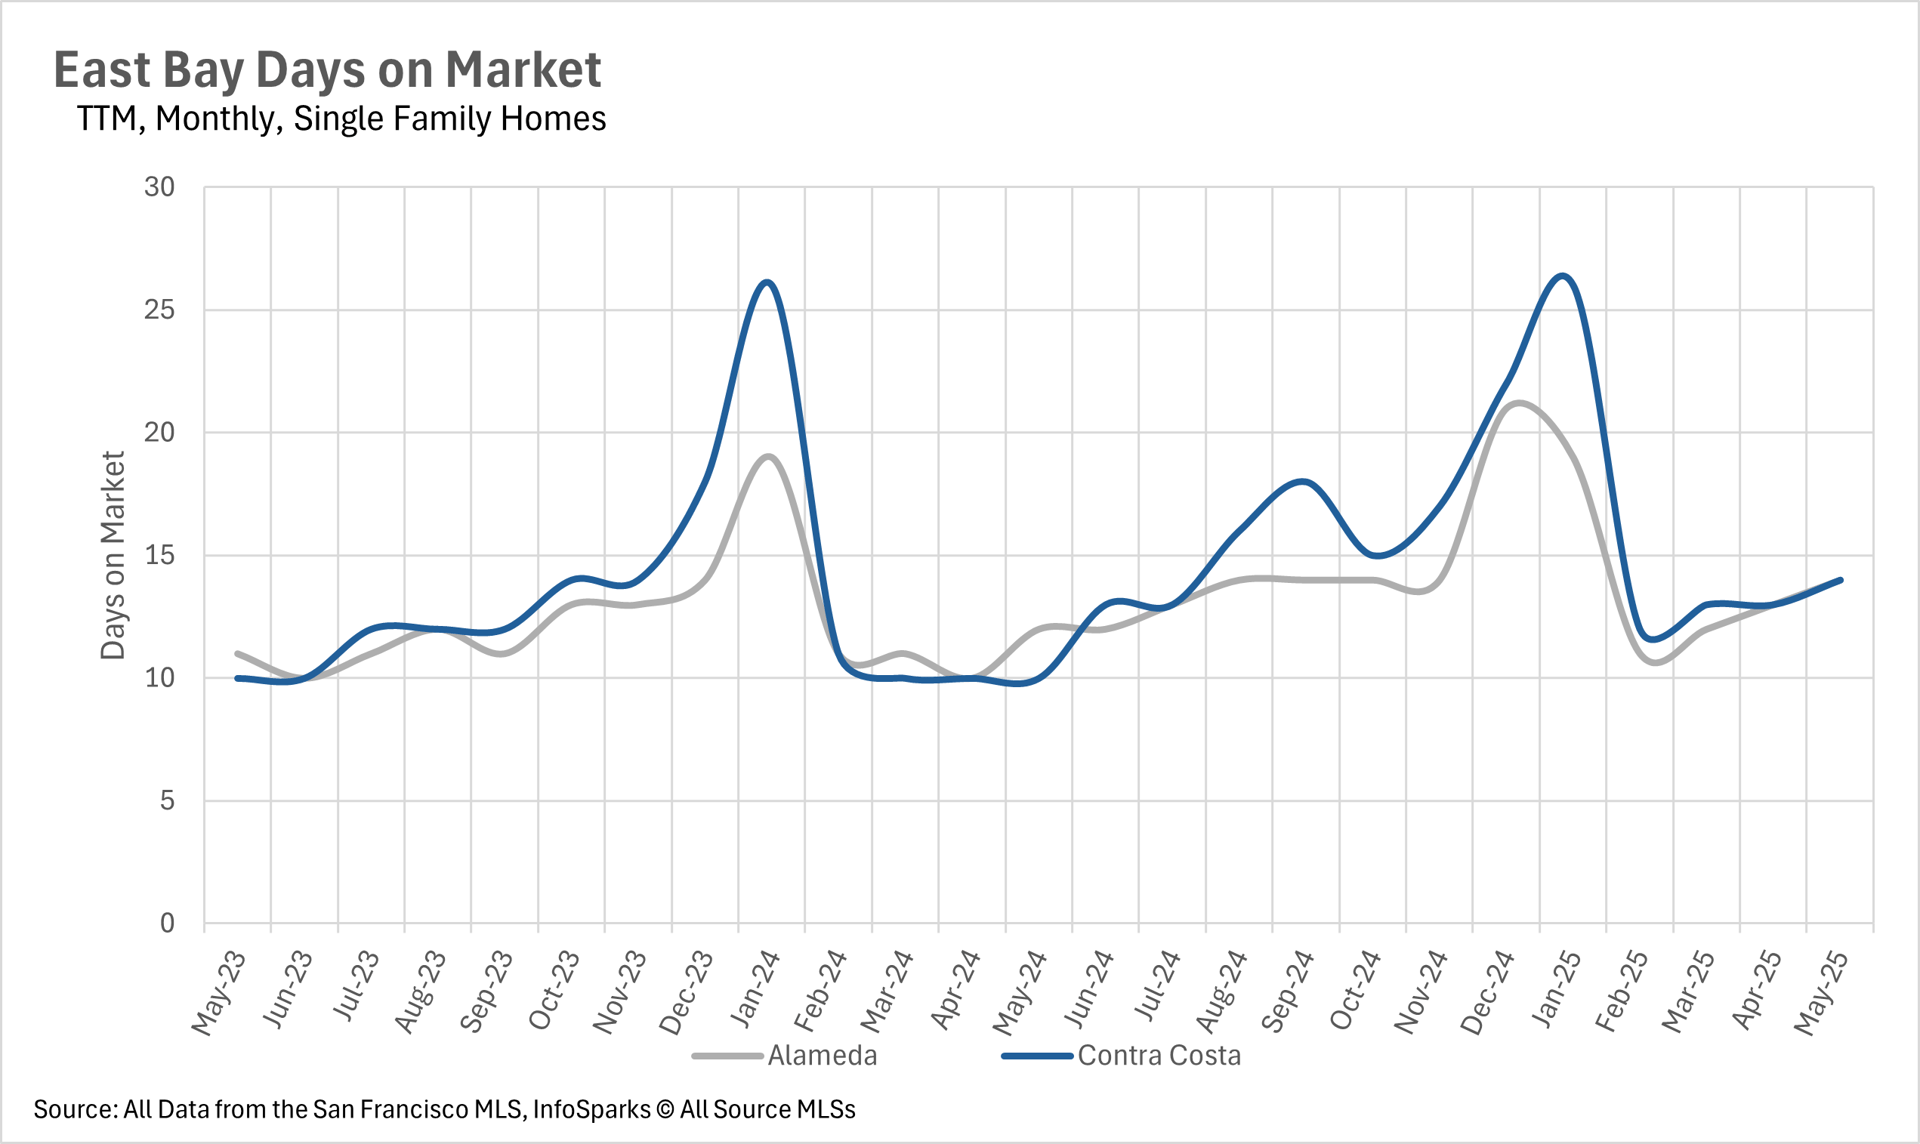
  • Despite varying market conditions, homes are selling relatively quickly throughout most of the Bay Area, though condos are taking considerably longer in some areas.

The Bay Area shows a clear split:

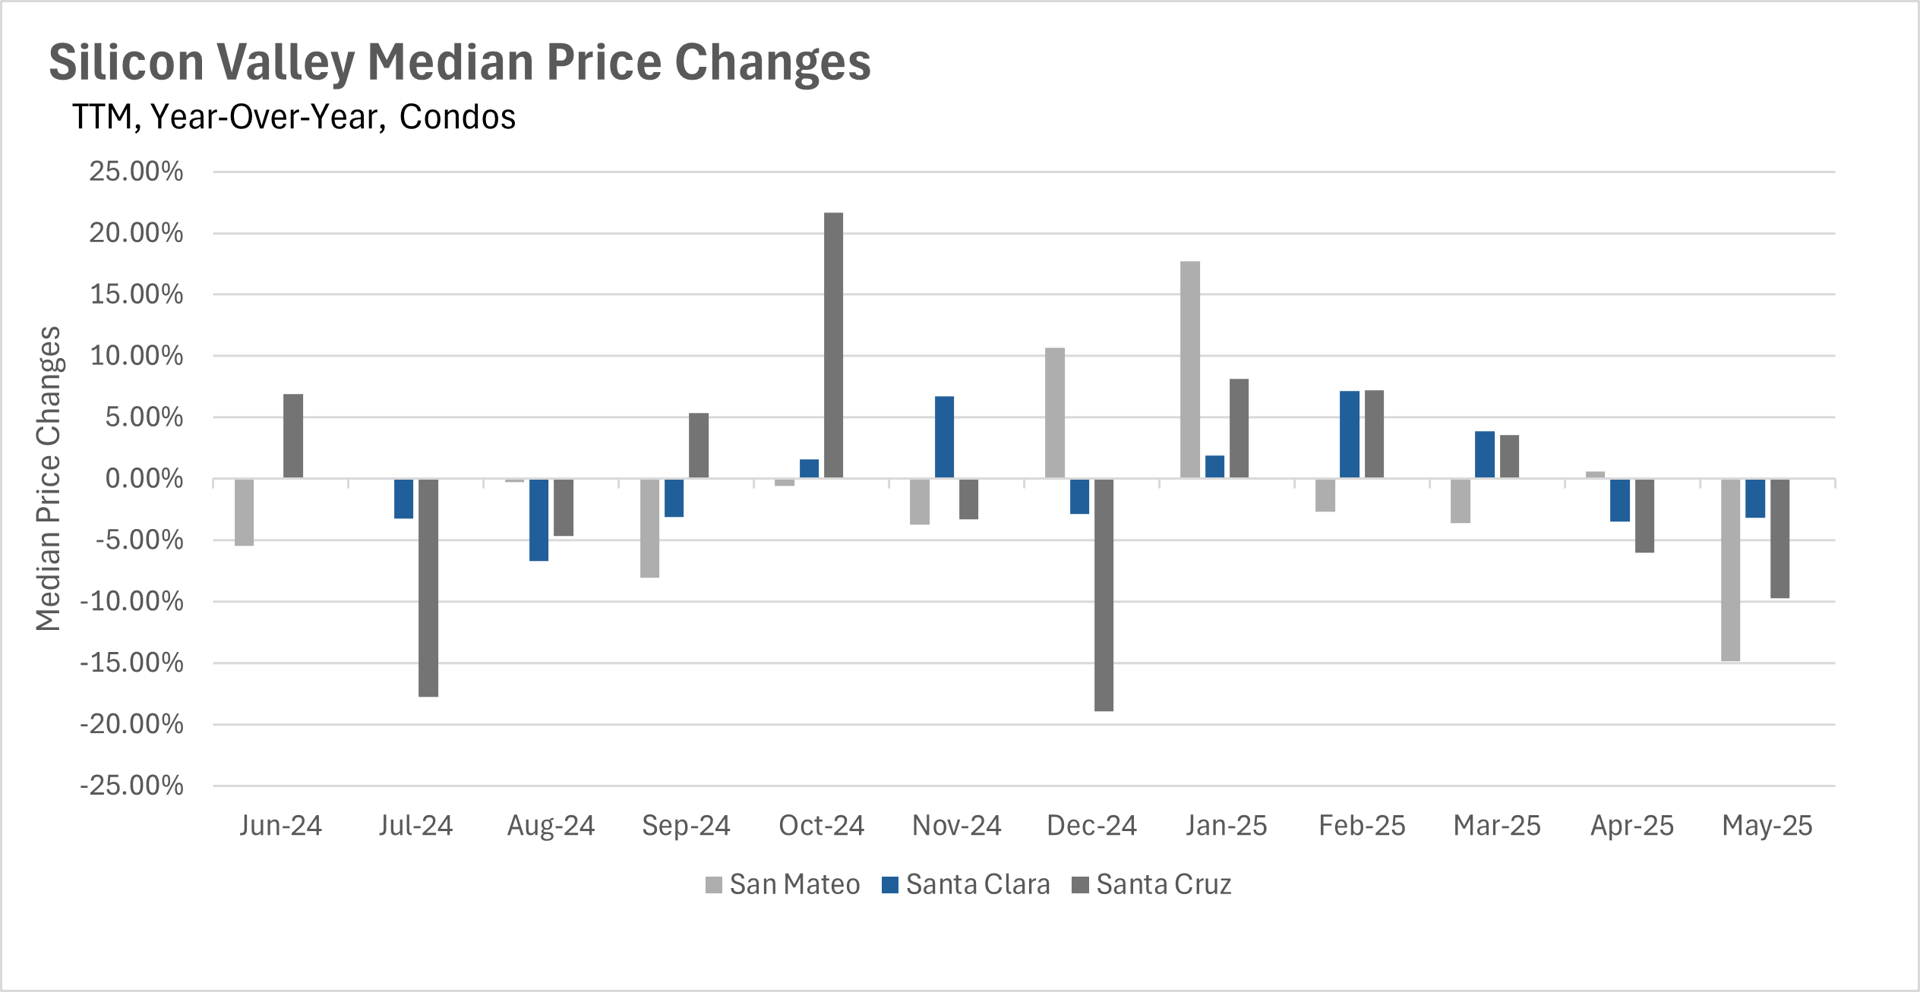
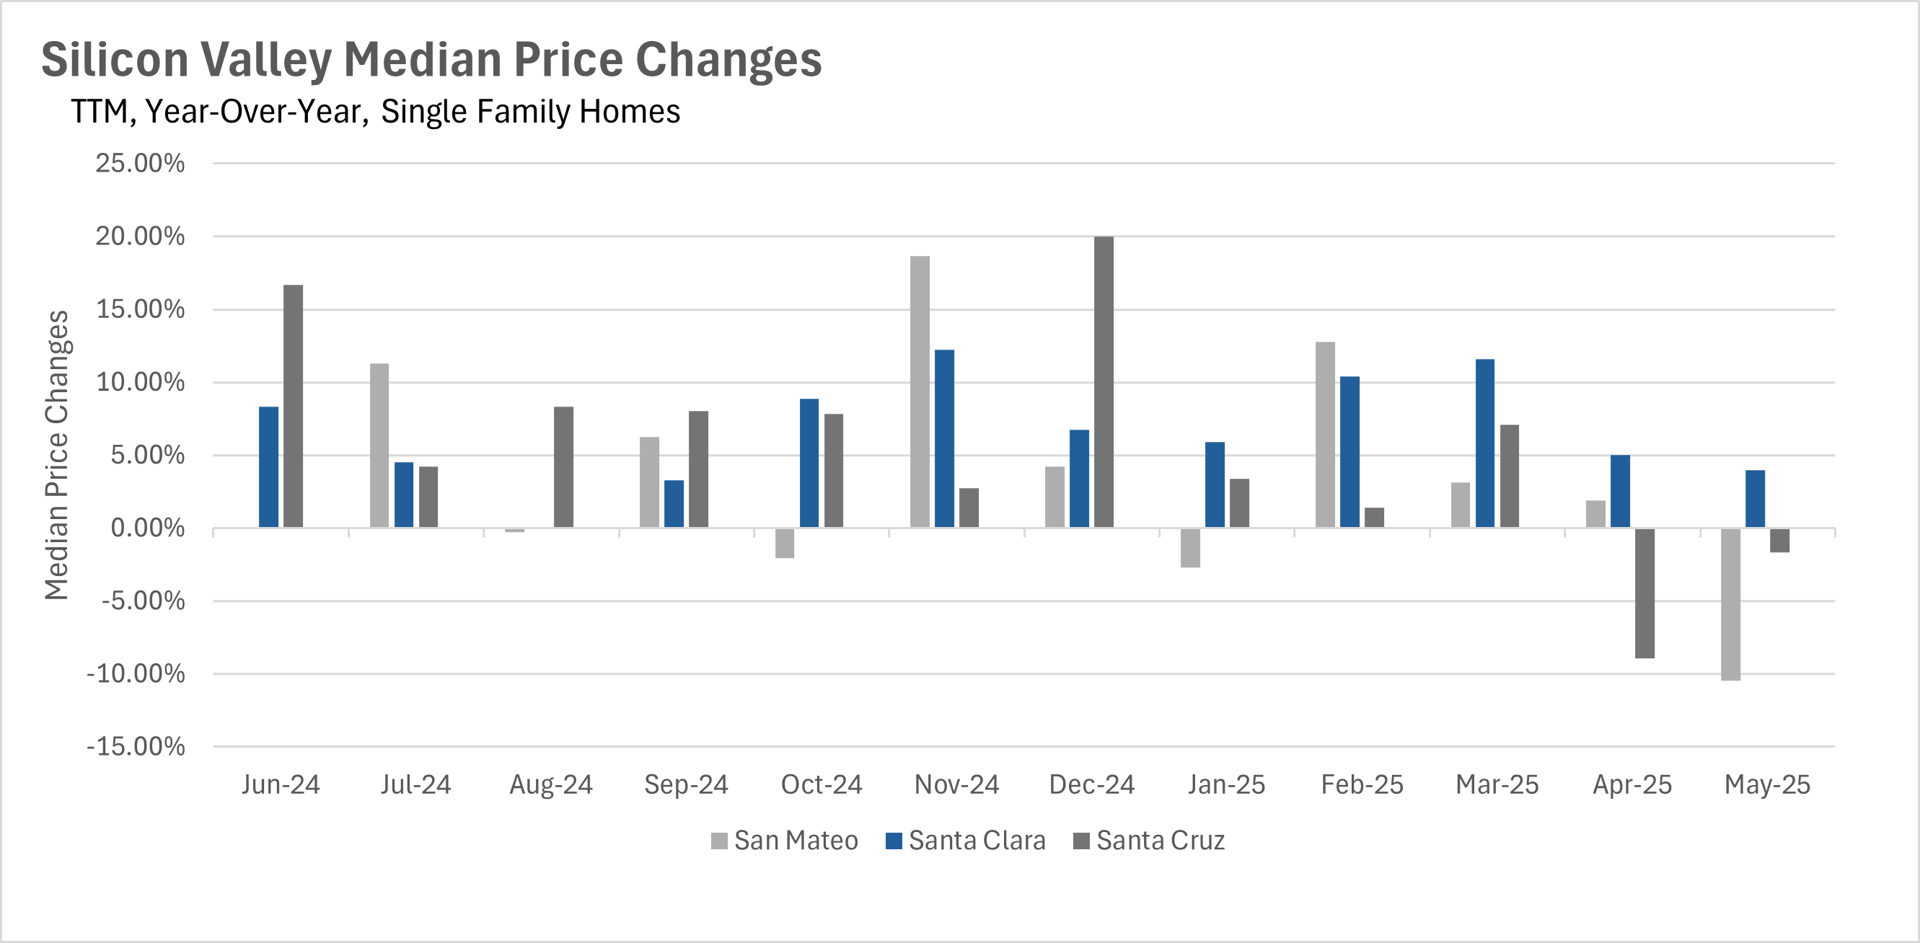
San Francisco led the Bay Area in May with strong price gains—single-family homes up 7.58% and condos up 8.26%, hitting two-year highs. In contrast, Silicon Valley cooled: Santa Cruz and San Mateo saw declines, while Santa Clara posted a modest 3.99% gain. Condos dropped sharply across the region, especially in San Mateo (-14.88%).

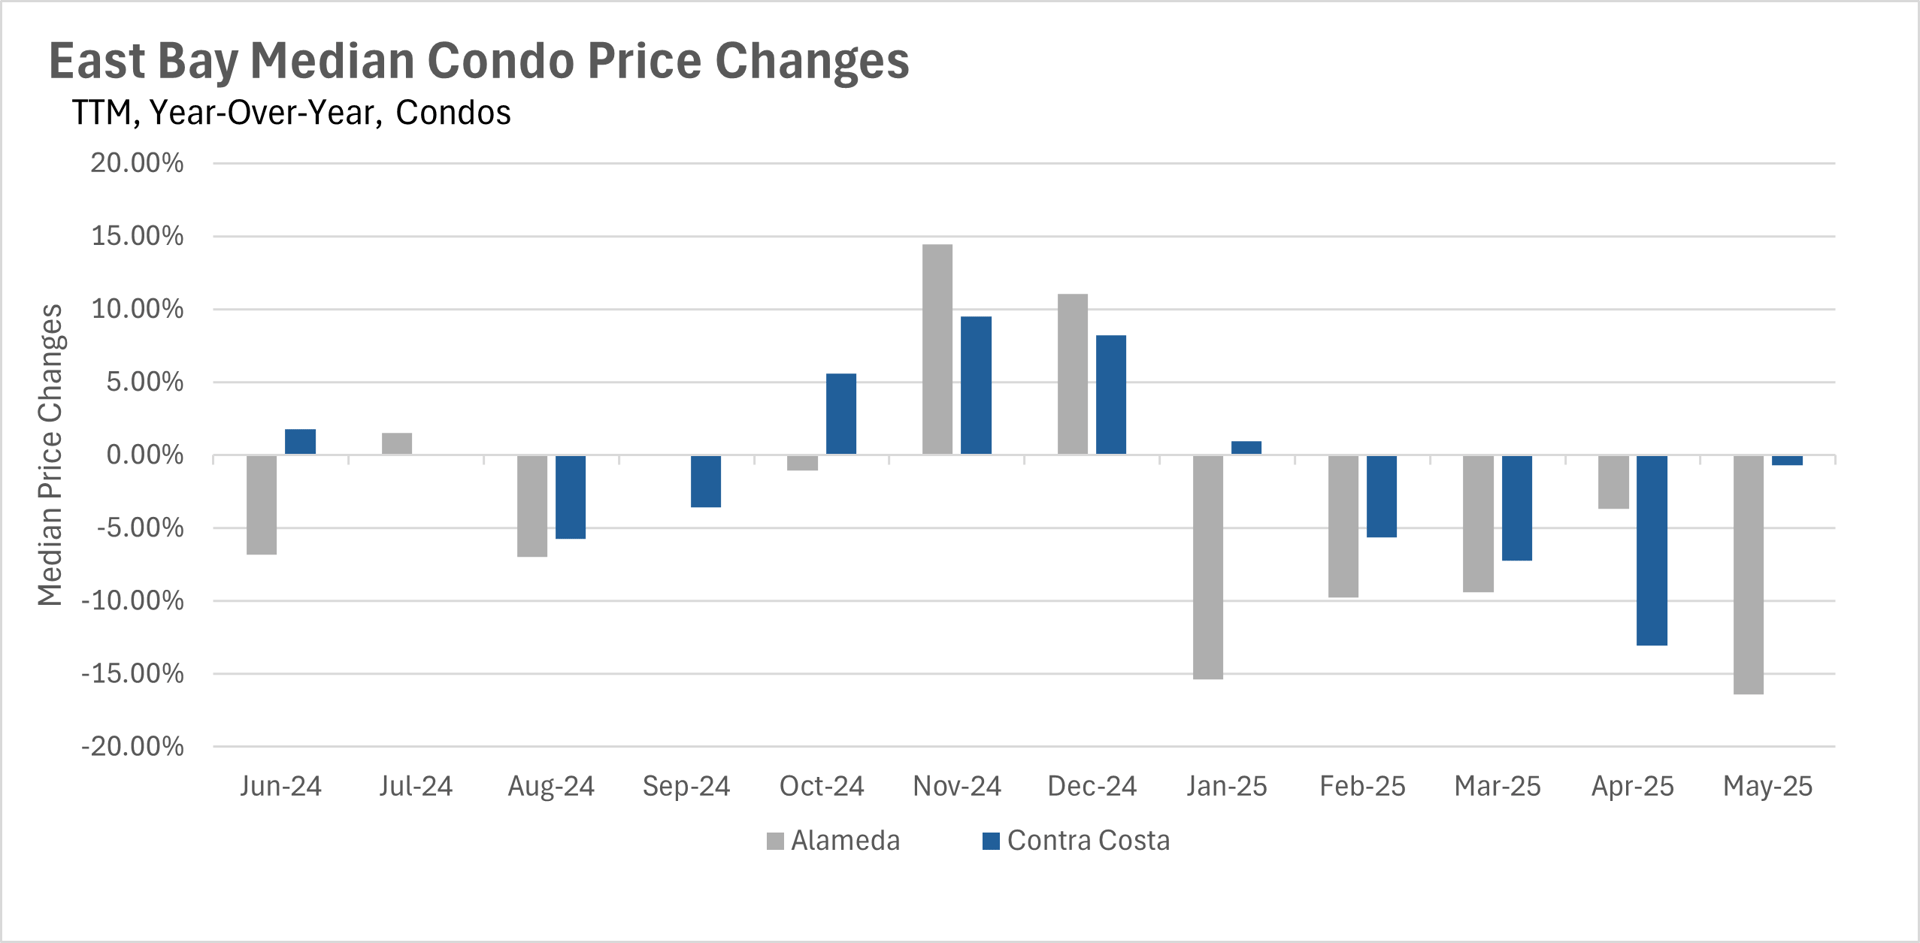
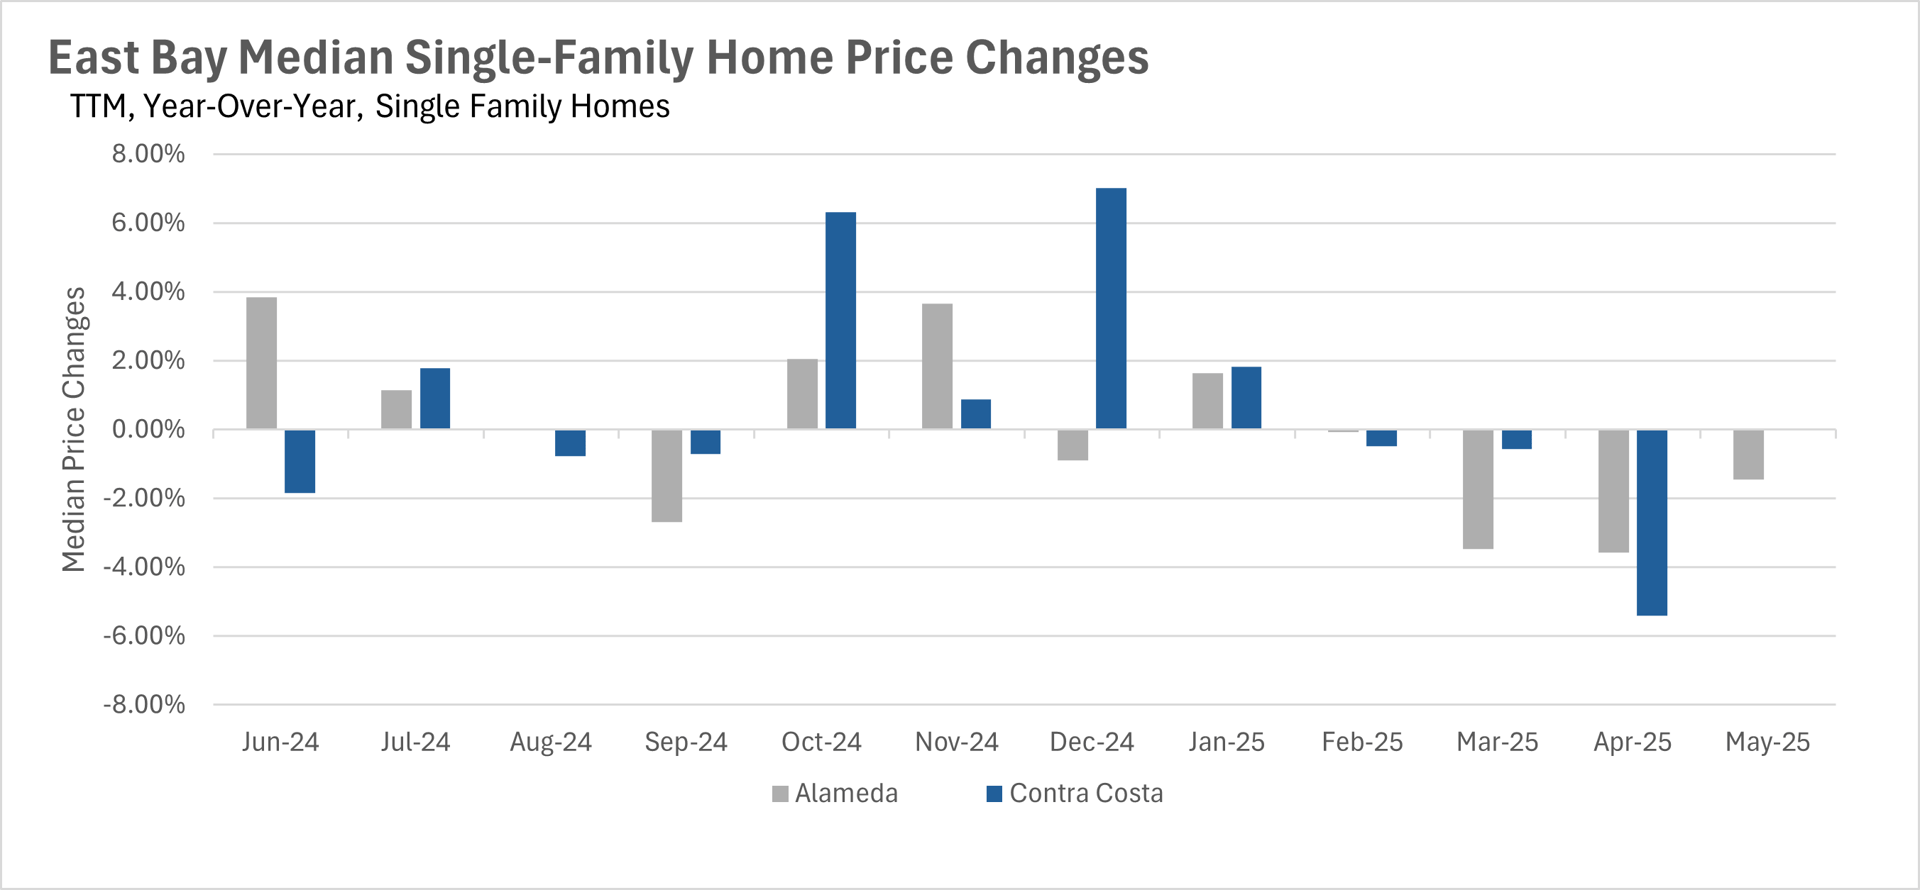
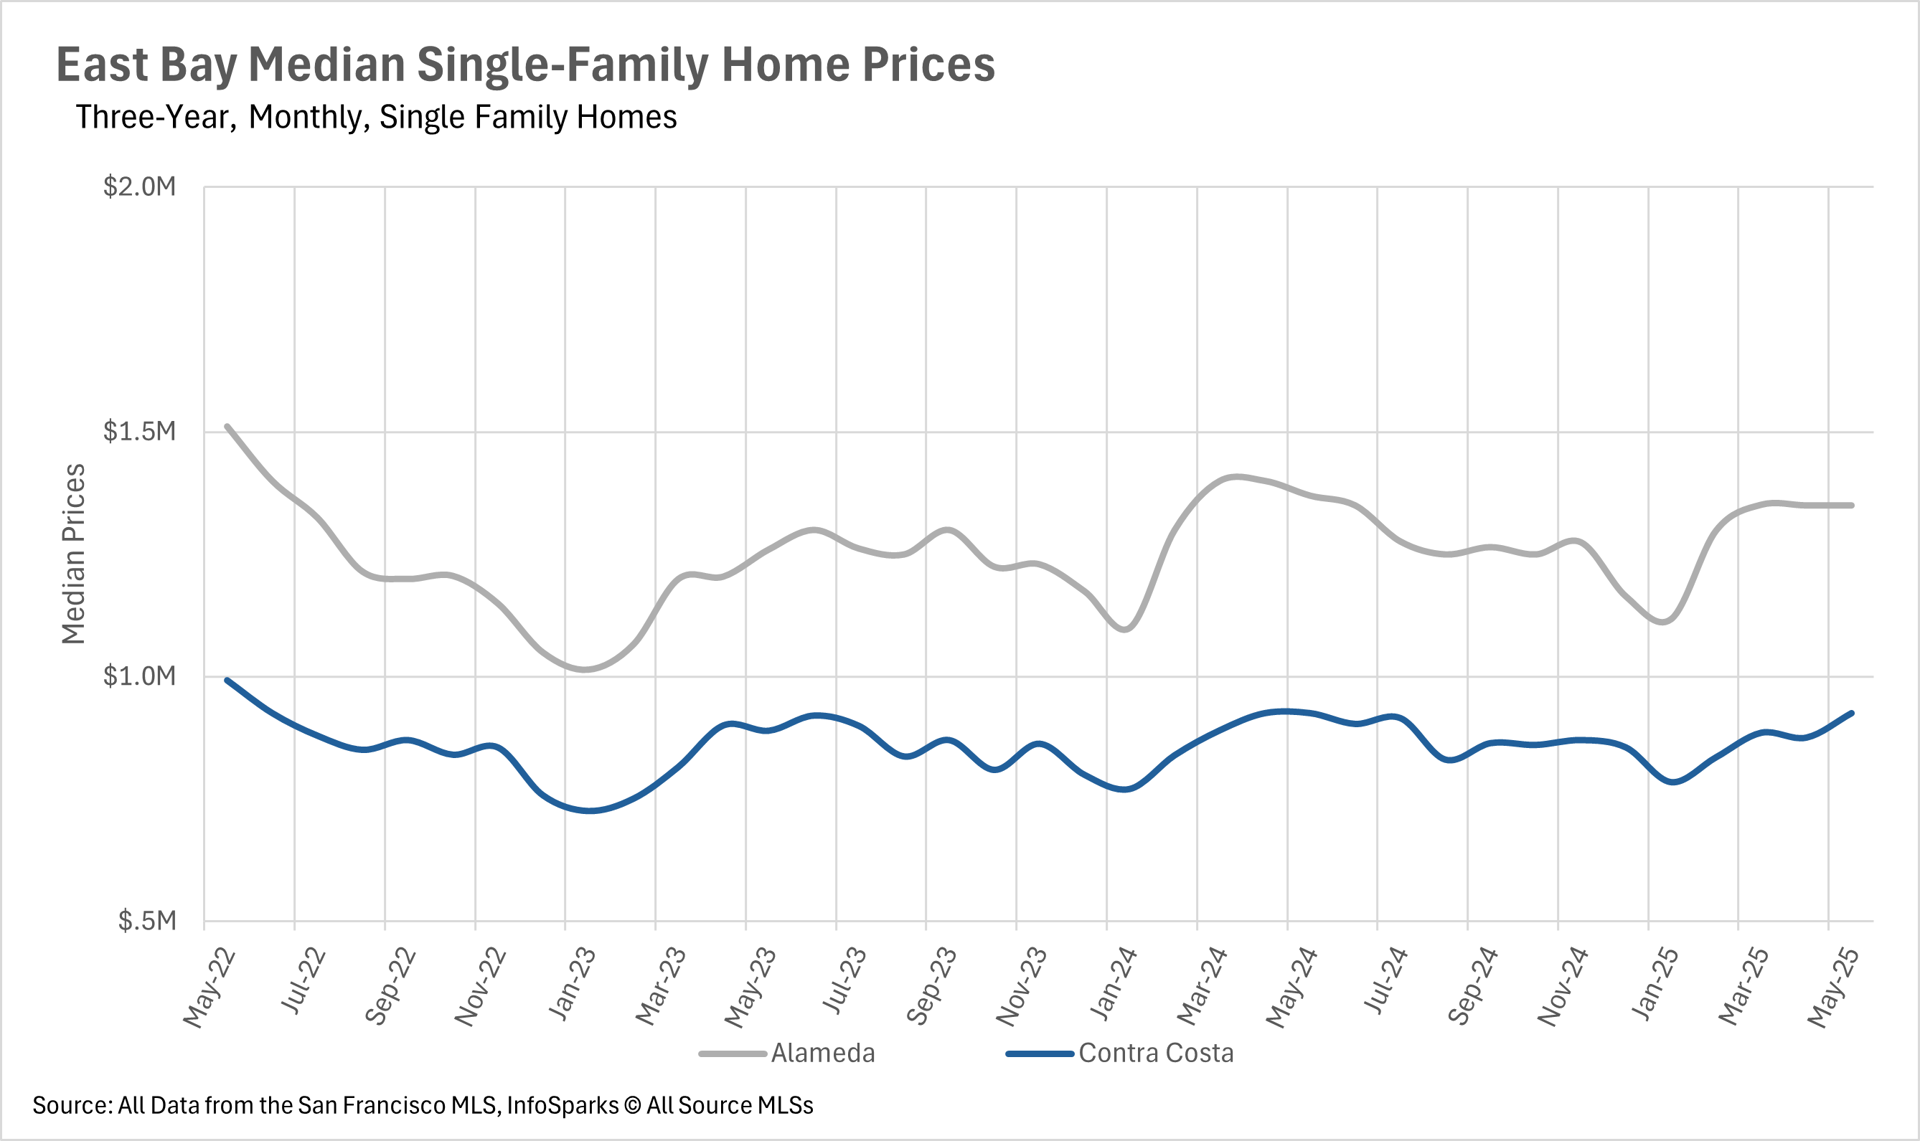
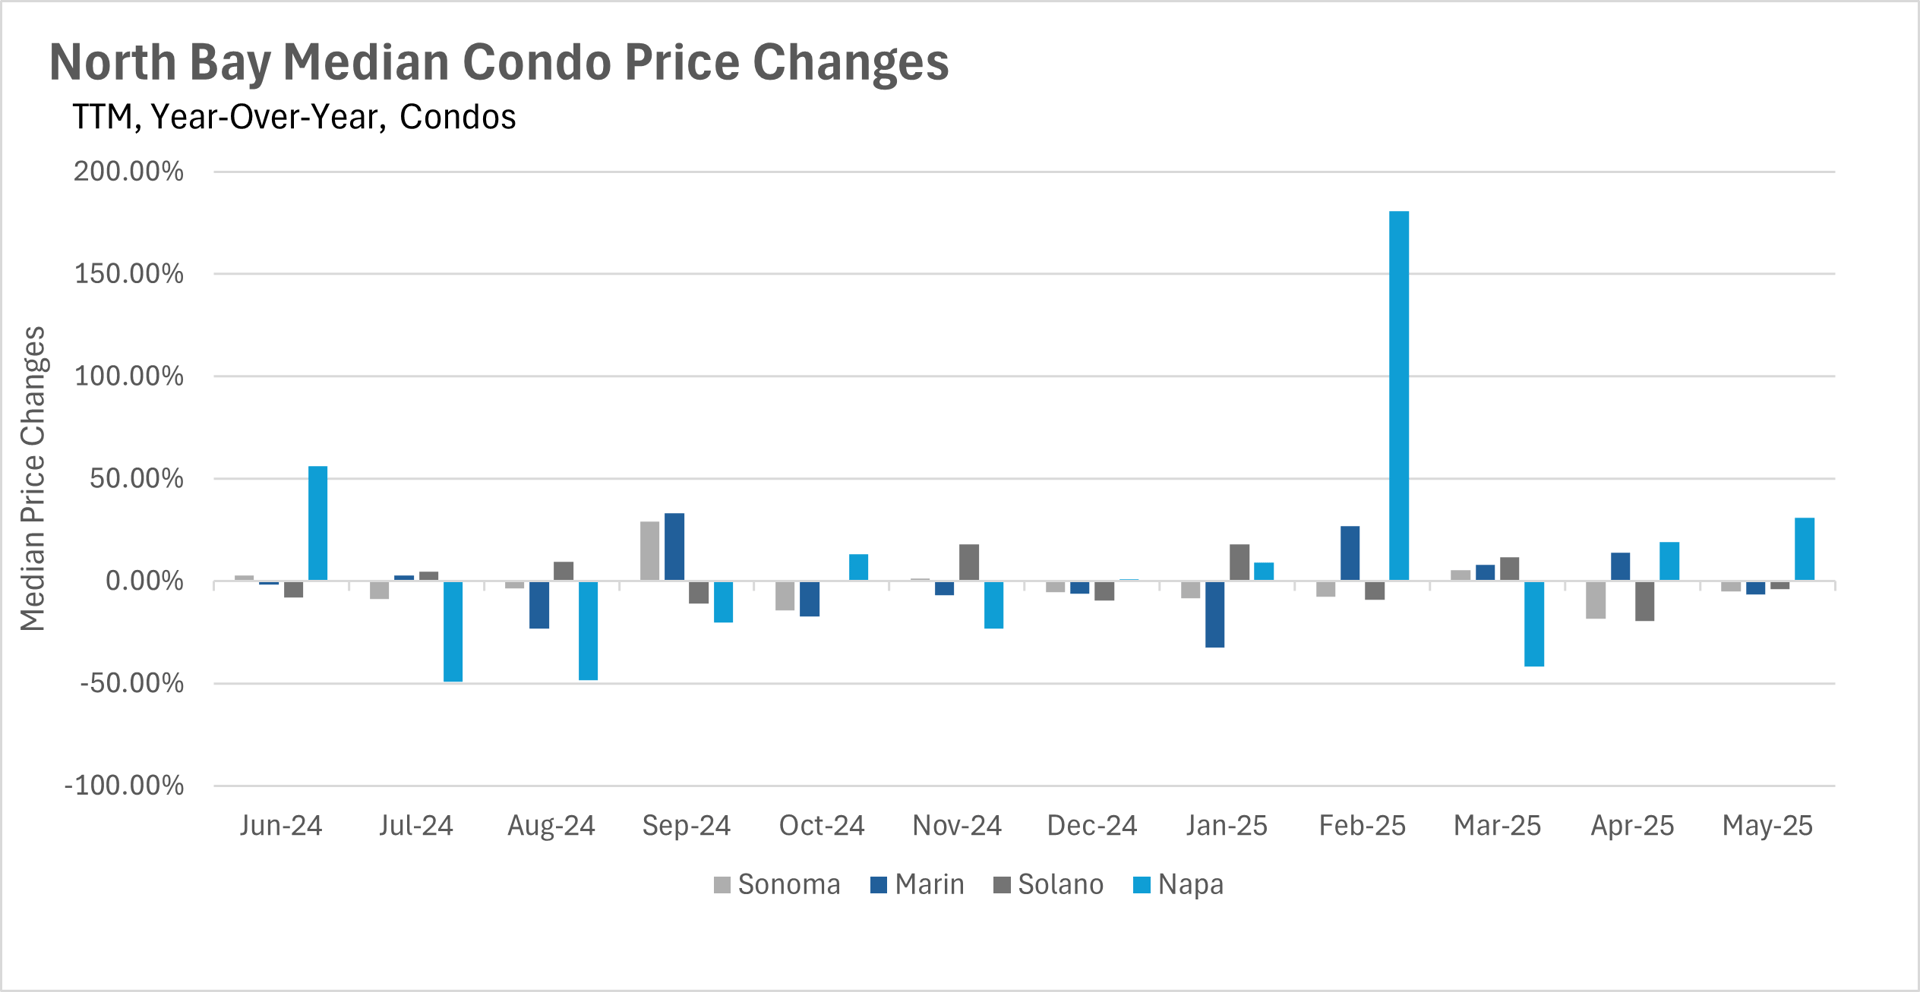
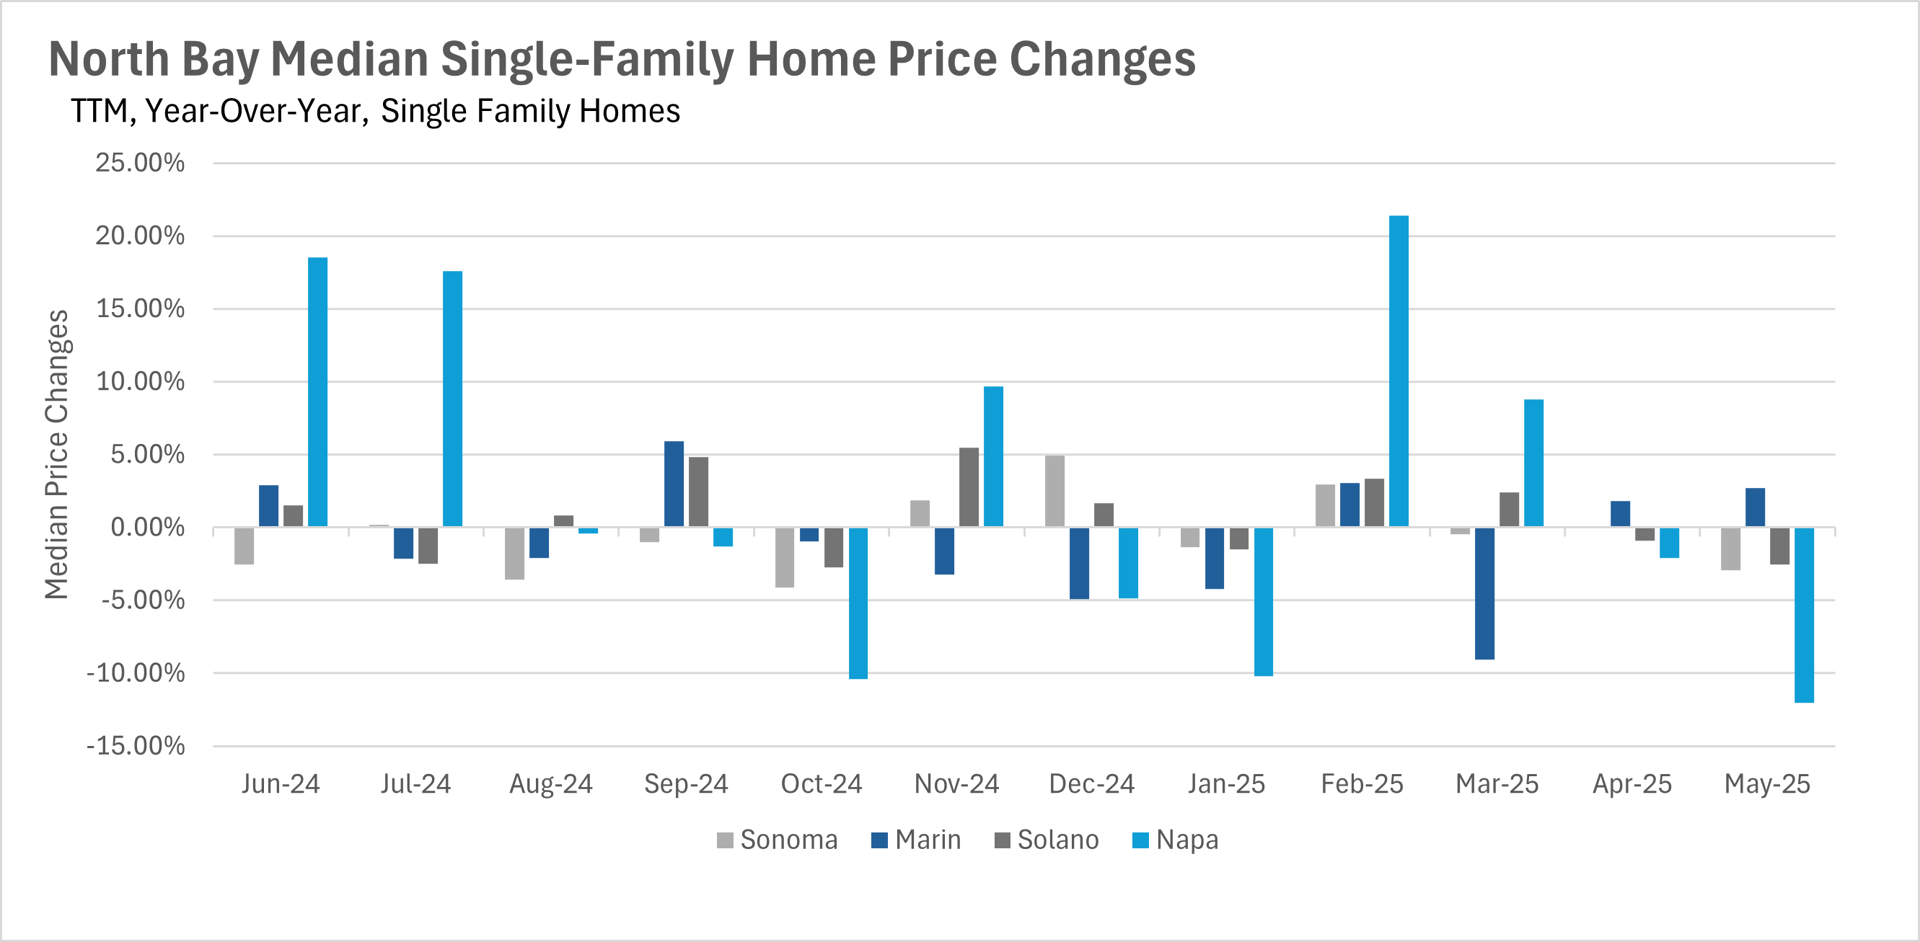
North Bay prices mostly fell, led by Napa’s 12.03% drop, though Marin edged up 2.72%. The East Bay was steady, with minor changes for homes but deeper drops for condos, especially in Alameda (-16.43%).

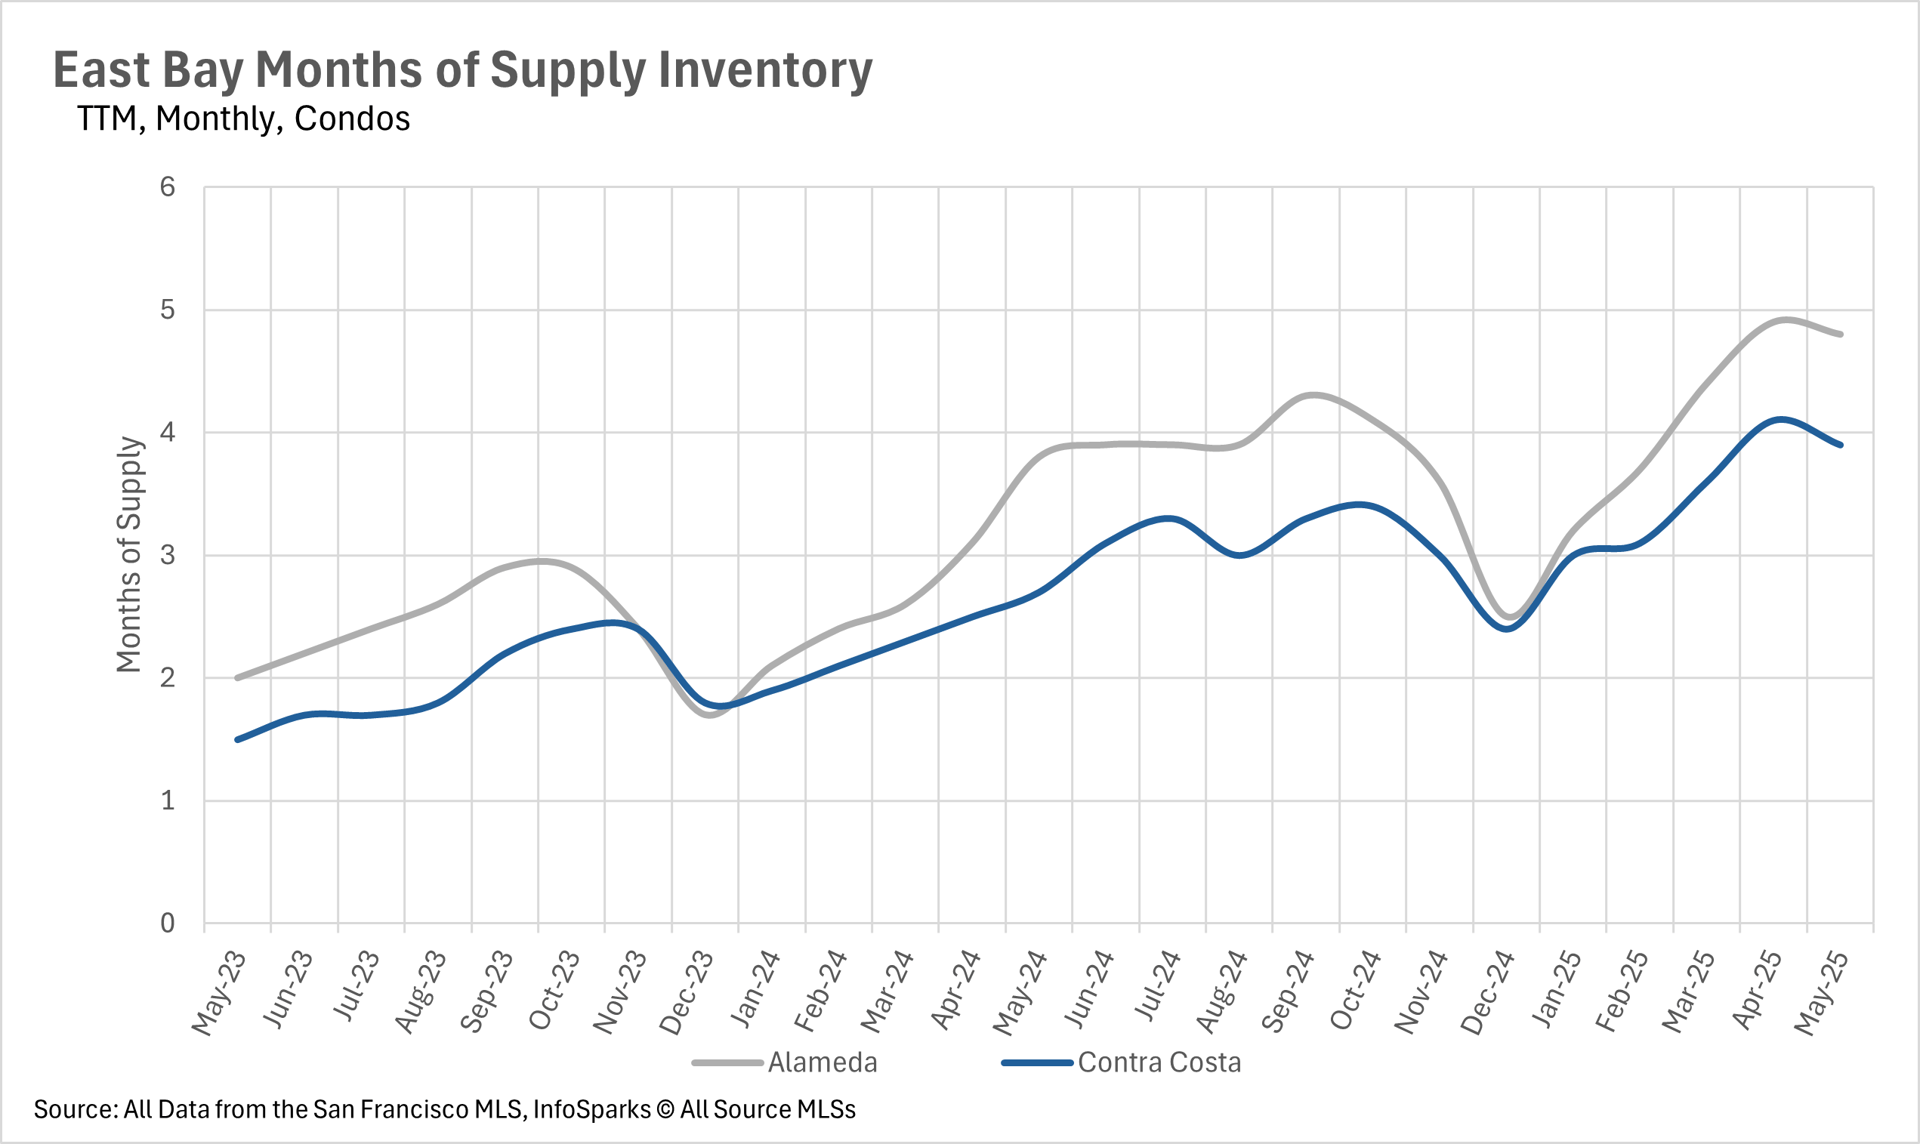
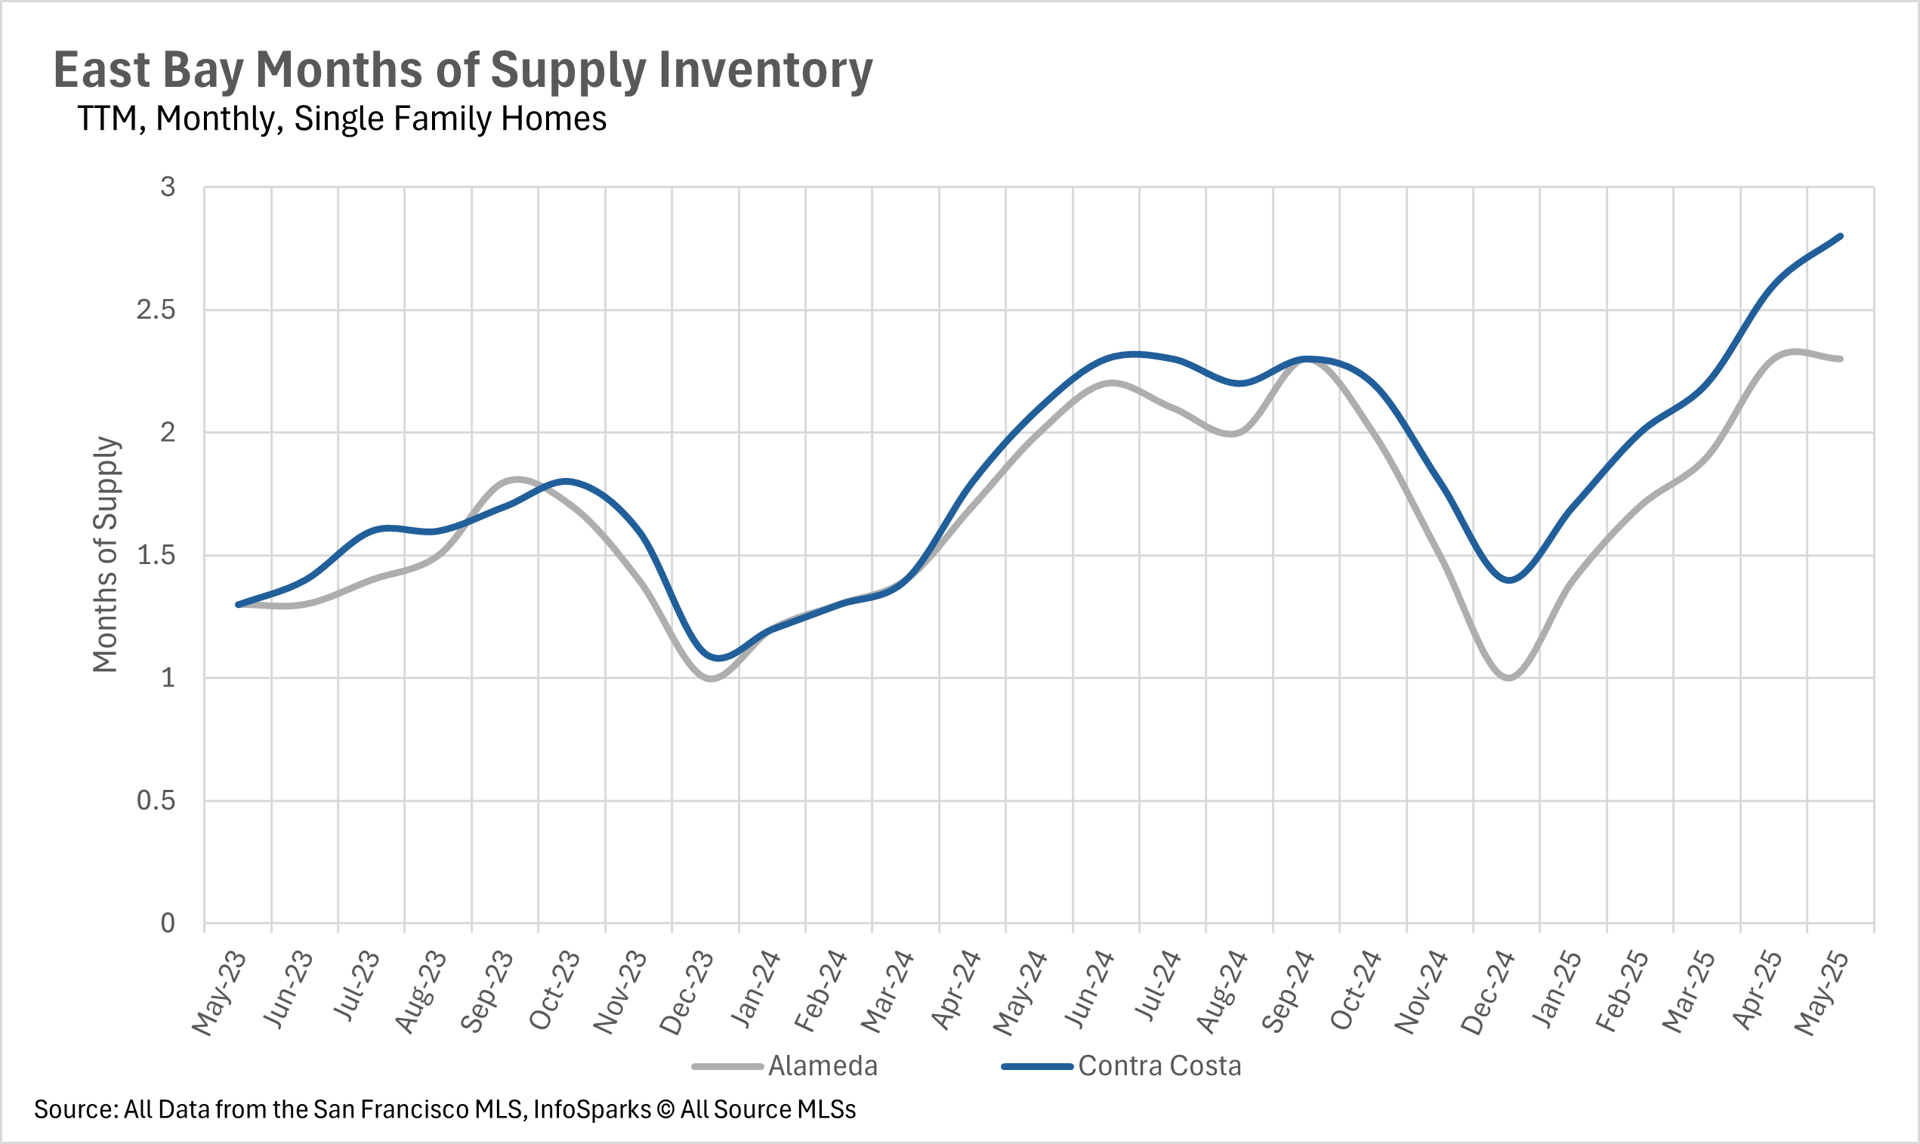
East Bay and Silicon Valley have rising inventory due to slower home sales, while San Francisco and the North Bayface declining supply. Homes are still selling quickly in SF and the East Bay, but condos—especially in Silicon Valley—are taking much longer to move. Single-family homes remain in a seller’s market, while condos are shifting toward buyers across the region.

➡️ Bottom line: Whether you’re buying or selling, property type matters more than location in today’s market.

EAST BAY

Line chart of condo days on market in Alameda and Contra Costa, May 2023–May 2025.

East Bay days-on-market chart comparing Alameda and Contra Costa single-family homes, May 2023 to May 2025.

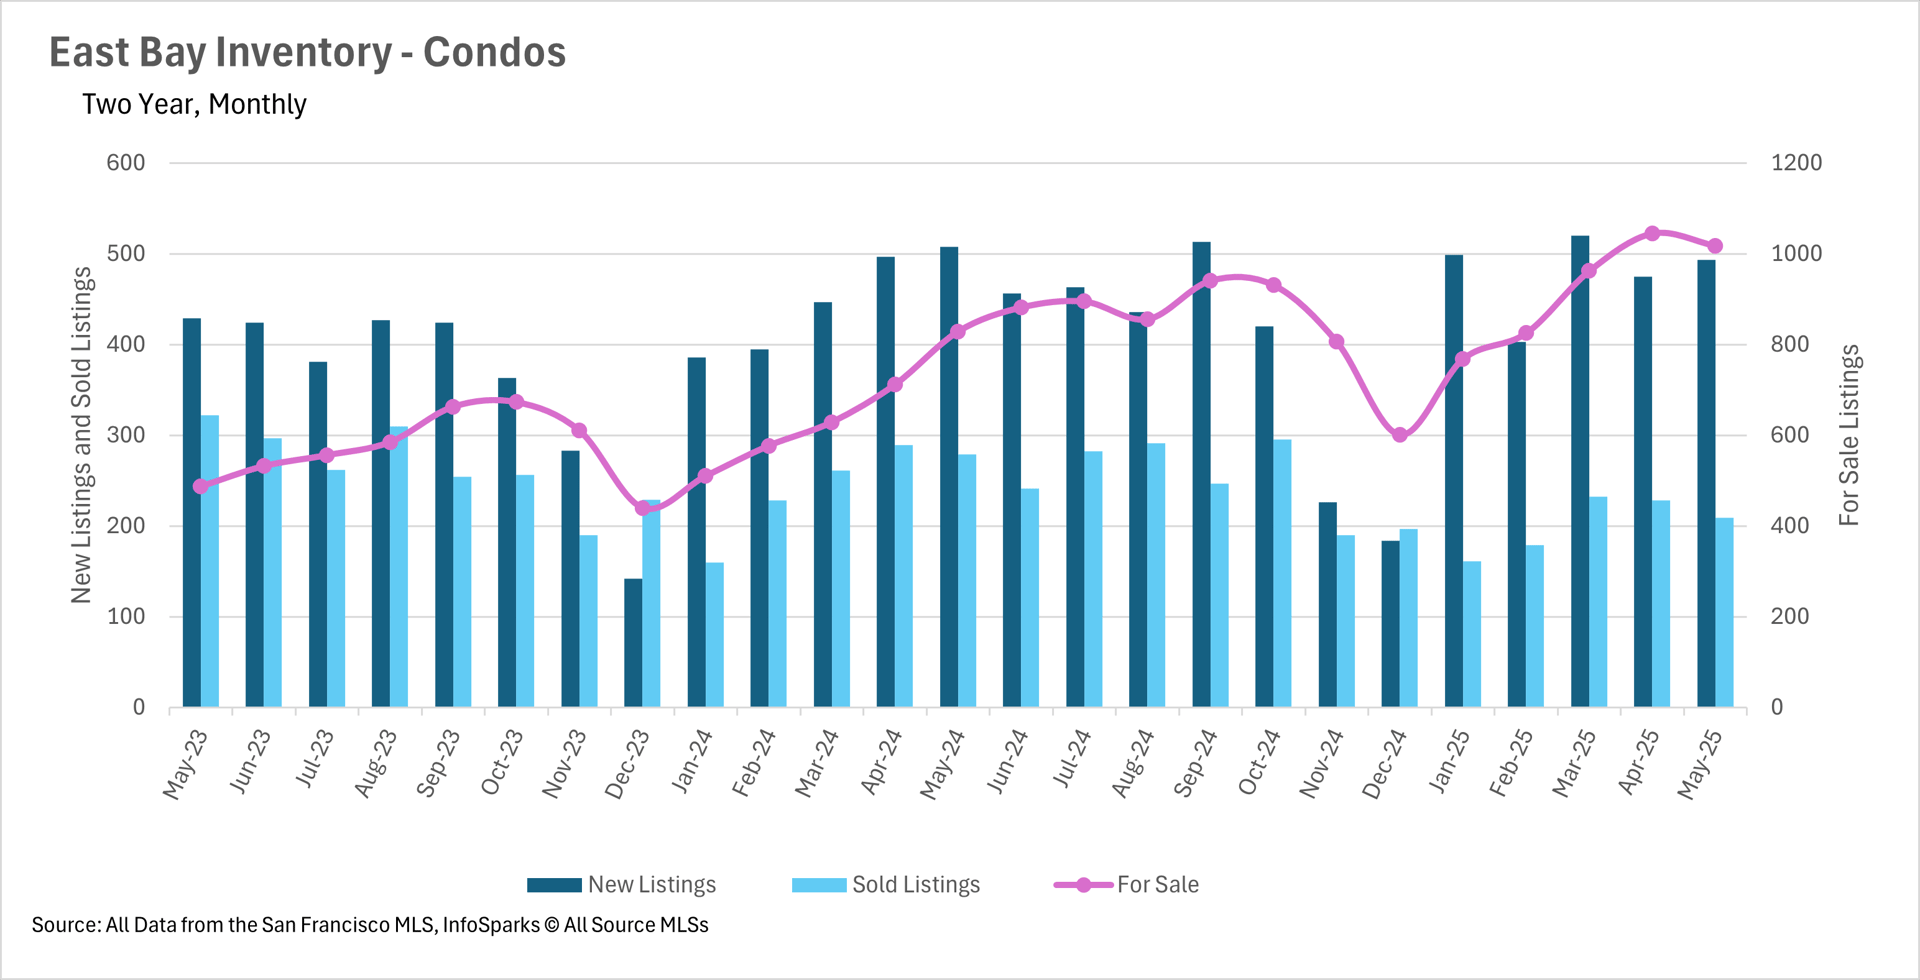
East Bay condo inventory: monthly new, sold, and for-sale listings, May 2023–May 2025.

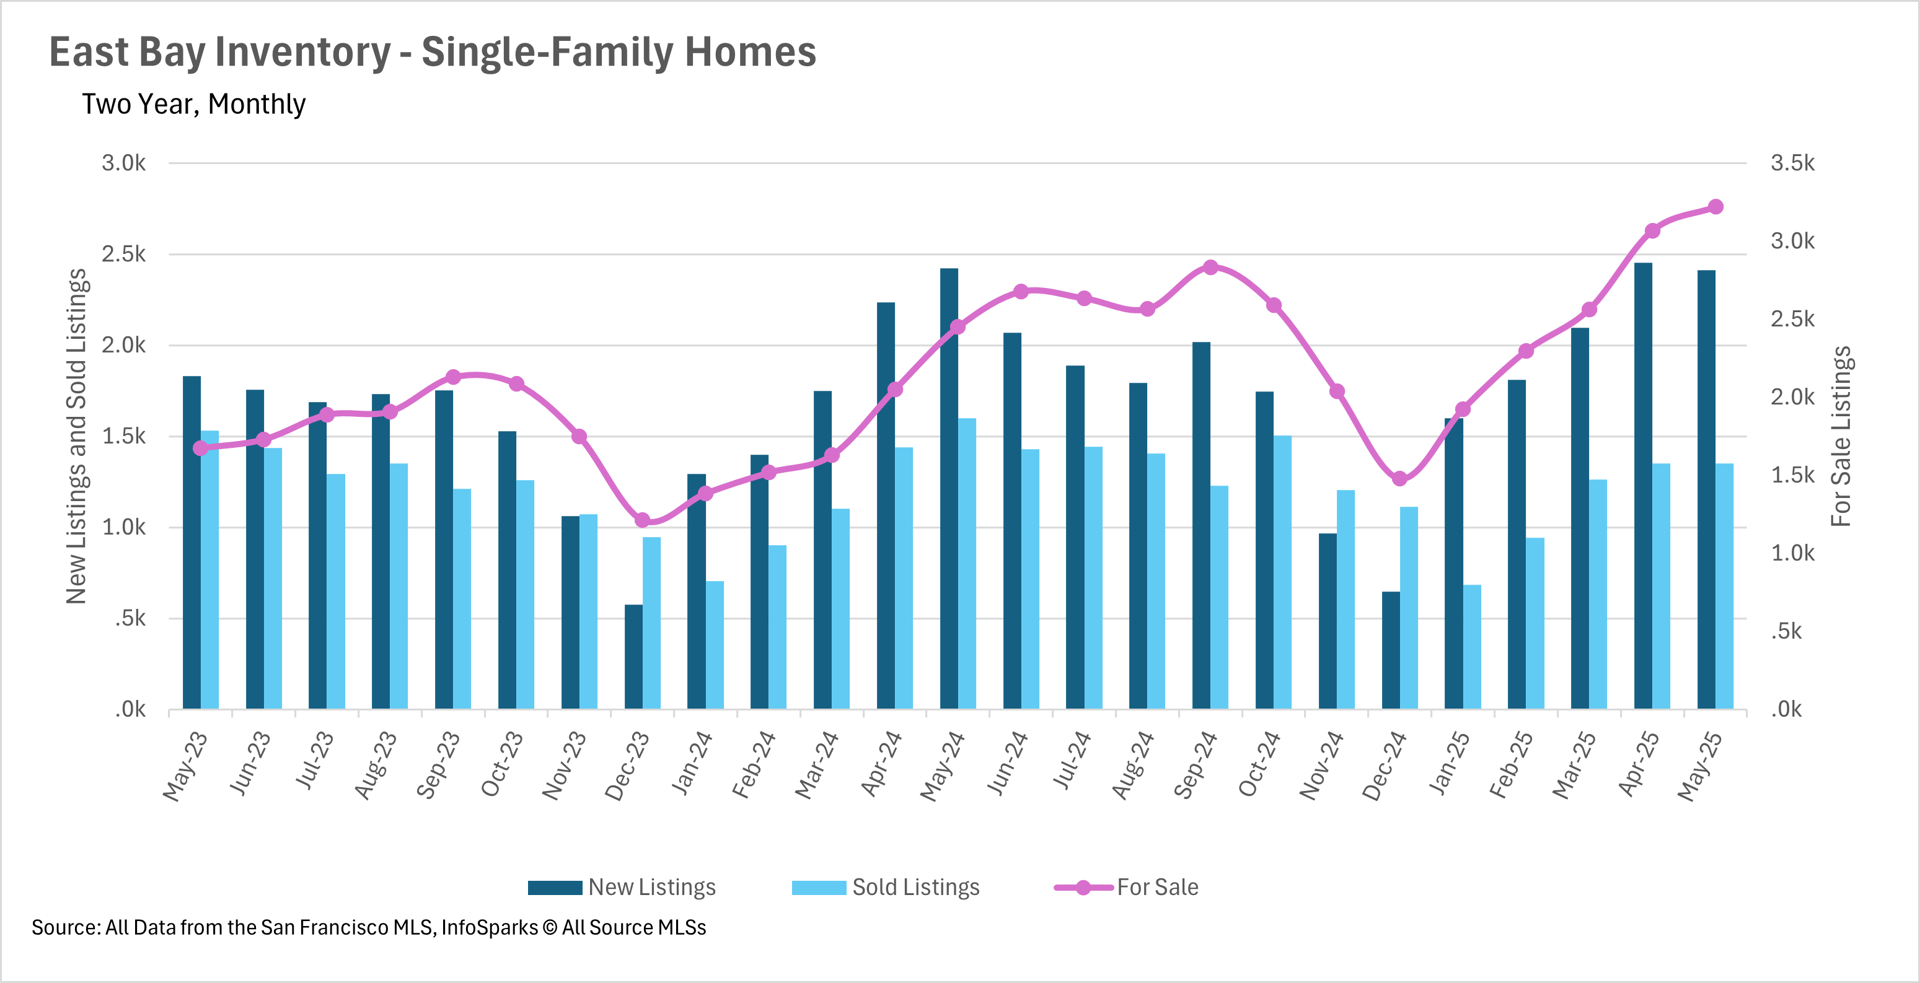
East Bay single-family home inventory chart, with monthly new and sold listings and homes for sale, May 2023–May 2025.

Bar chart of year-over-year East Bay condo price changes, June 2024–May 2025, for Alameda and Contra Costa.

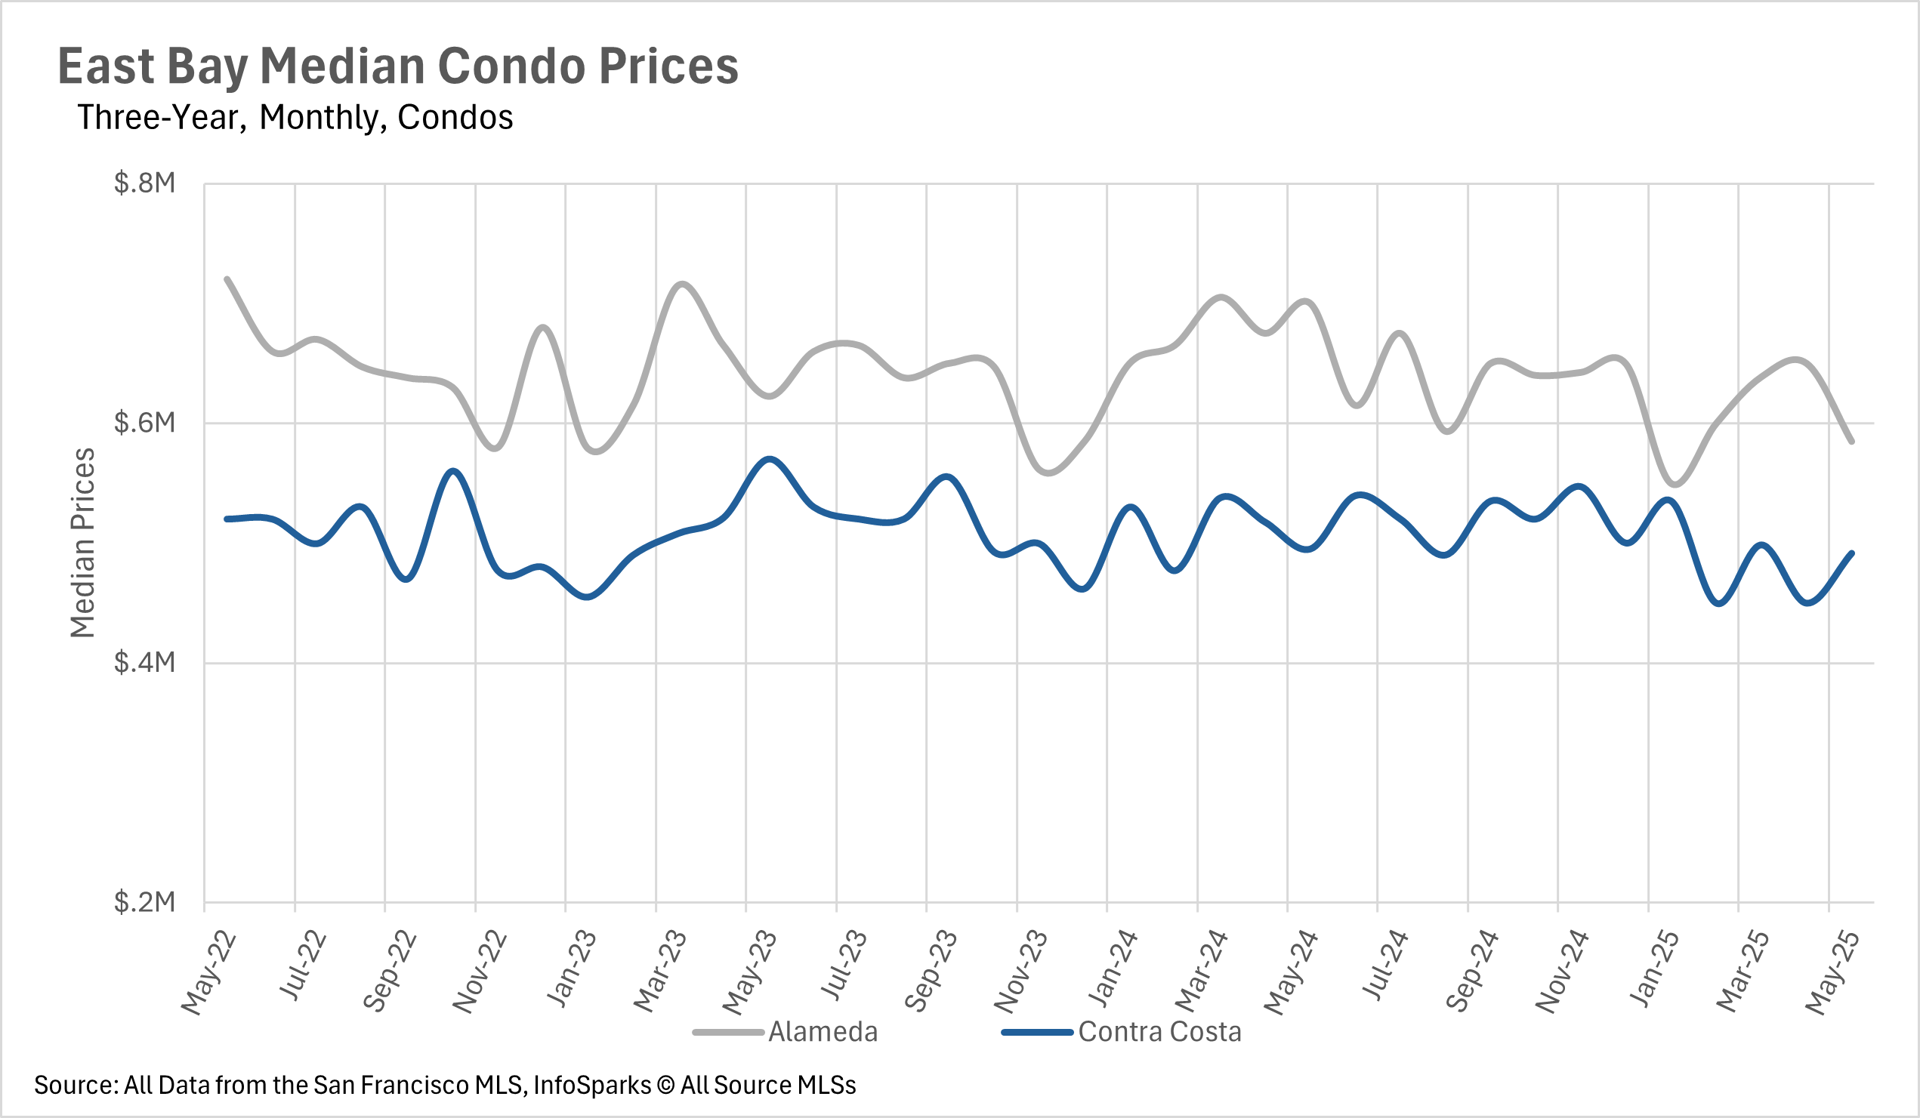
Chart of monthly East Bay condo prices, May 2022–May 2025, comparing Alameda and Contra Costa.

Bar chart comparing year-over-year single-family home price changes in Alameda and Contra Costa counties, June 2024–May 2025.

Chart of monthly East Bay single-family home prices in Alameda and Contra Costa counties, May 2022 to May 2025.

East Bay condo months of supply chart comparing Alameda and Contra Costa from May 2023 to May 2025.

Line chart comparing monthly single-family home supply in Alameda and Contra Costa counties, May 2023 to May 2025.

 NORTH BAY

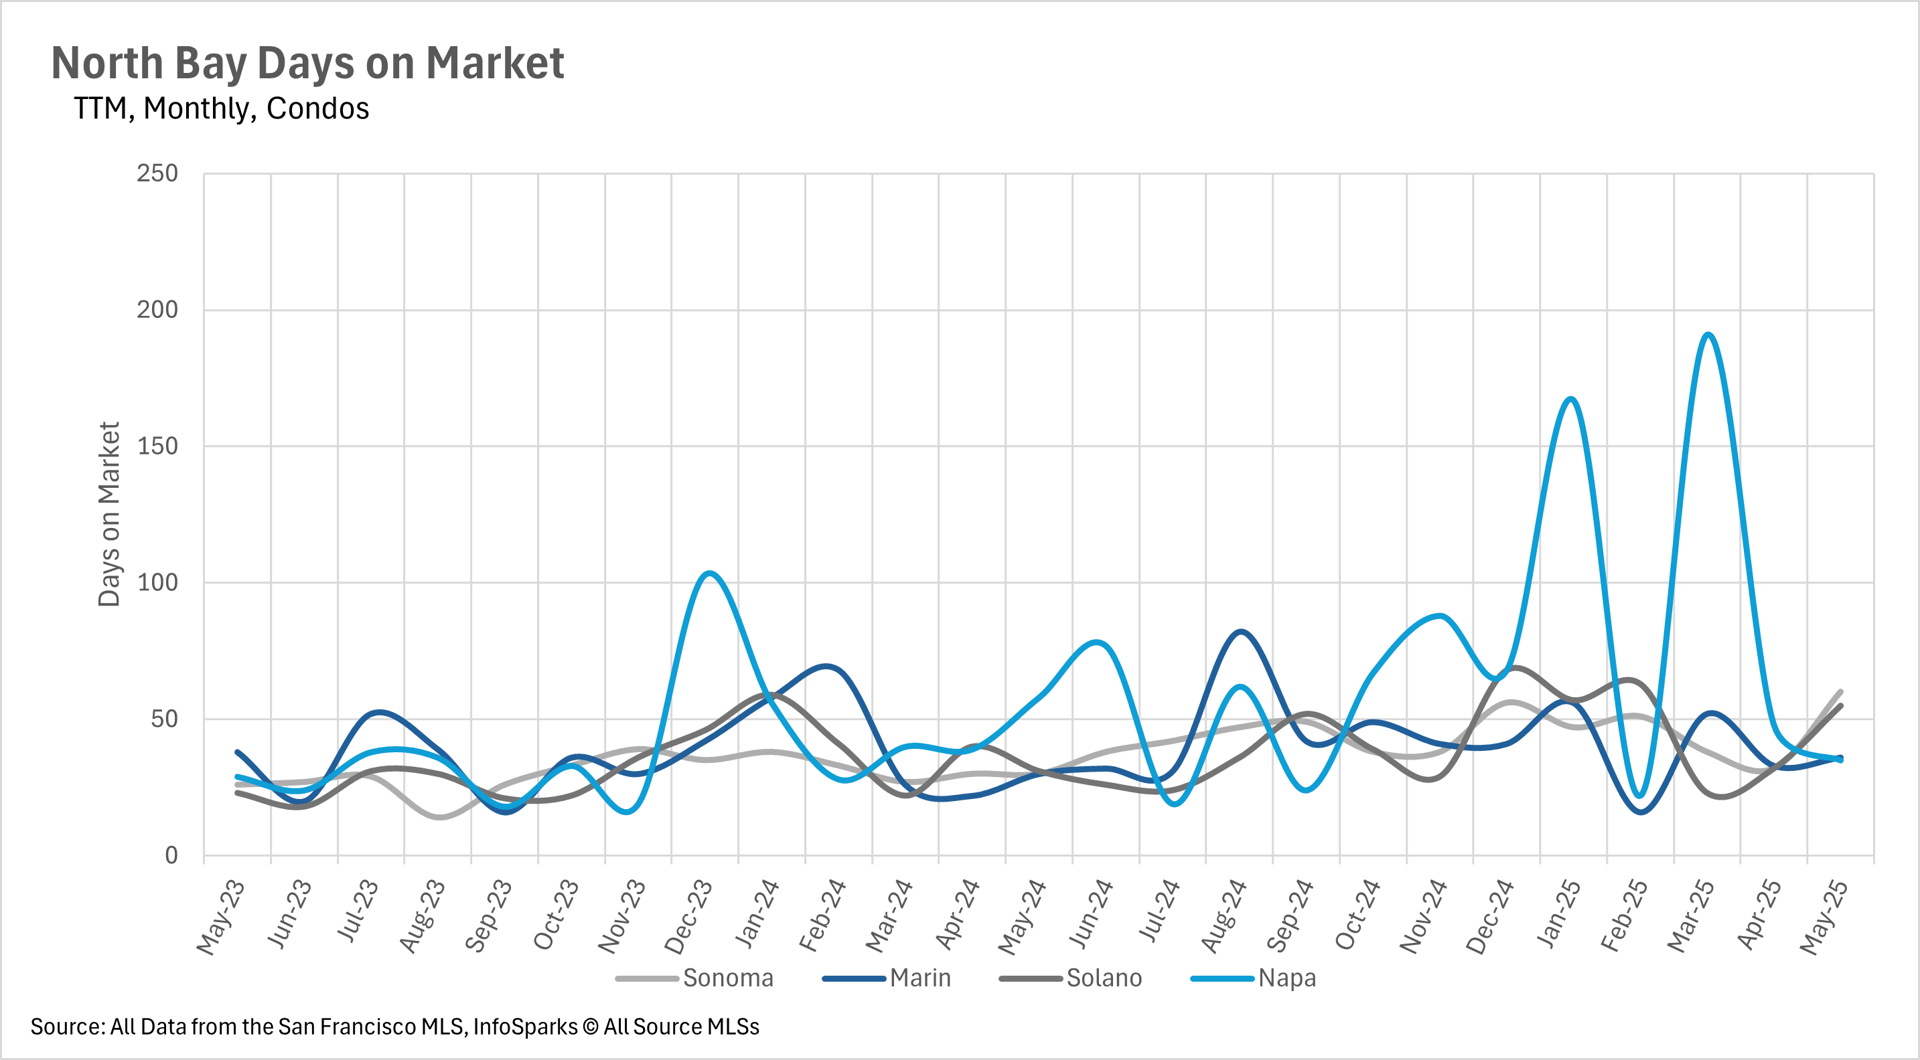
Line chart comparing monthly condo days on market in Sonoma, Marin, Solano, and Napa from May 2023 to May 2025.

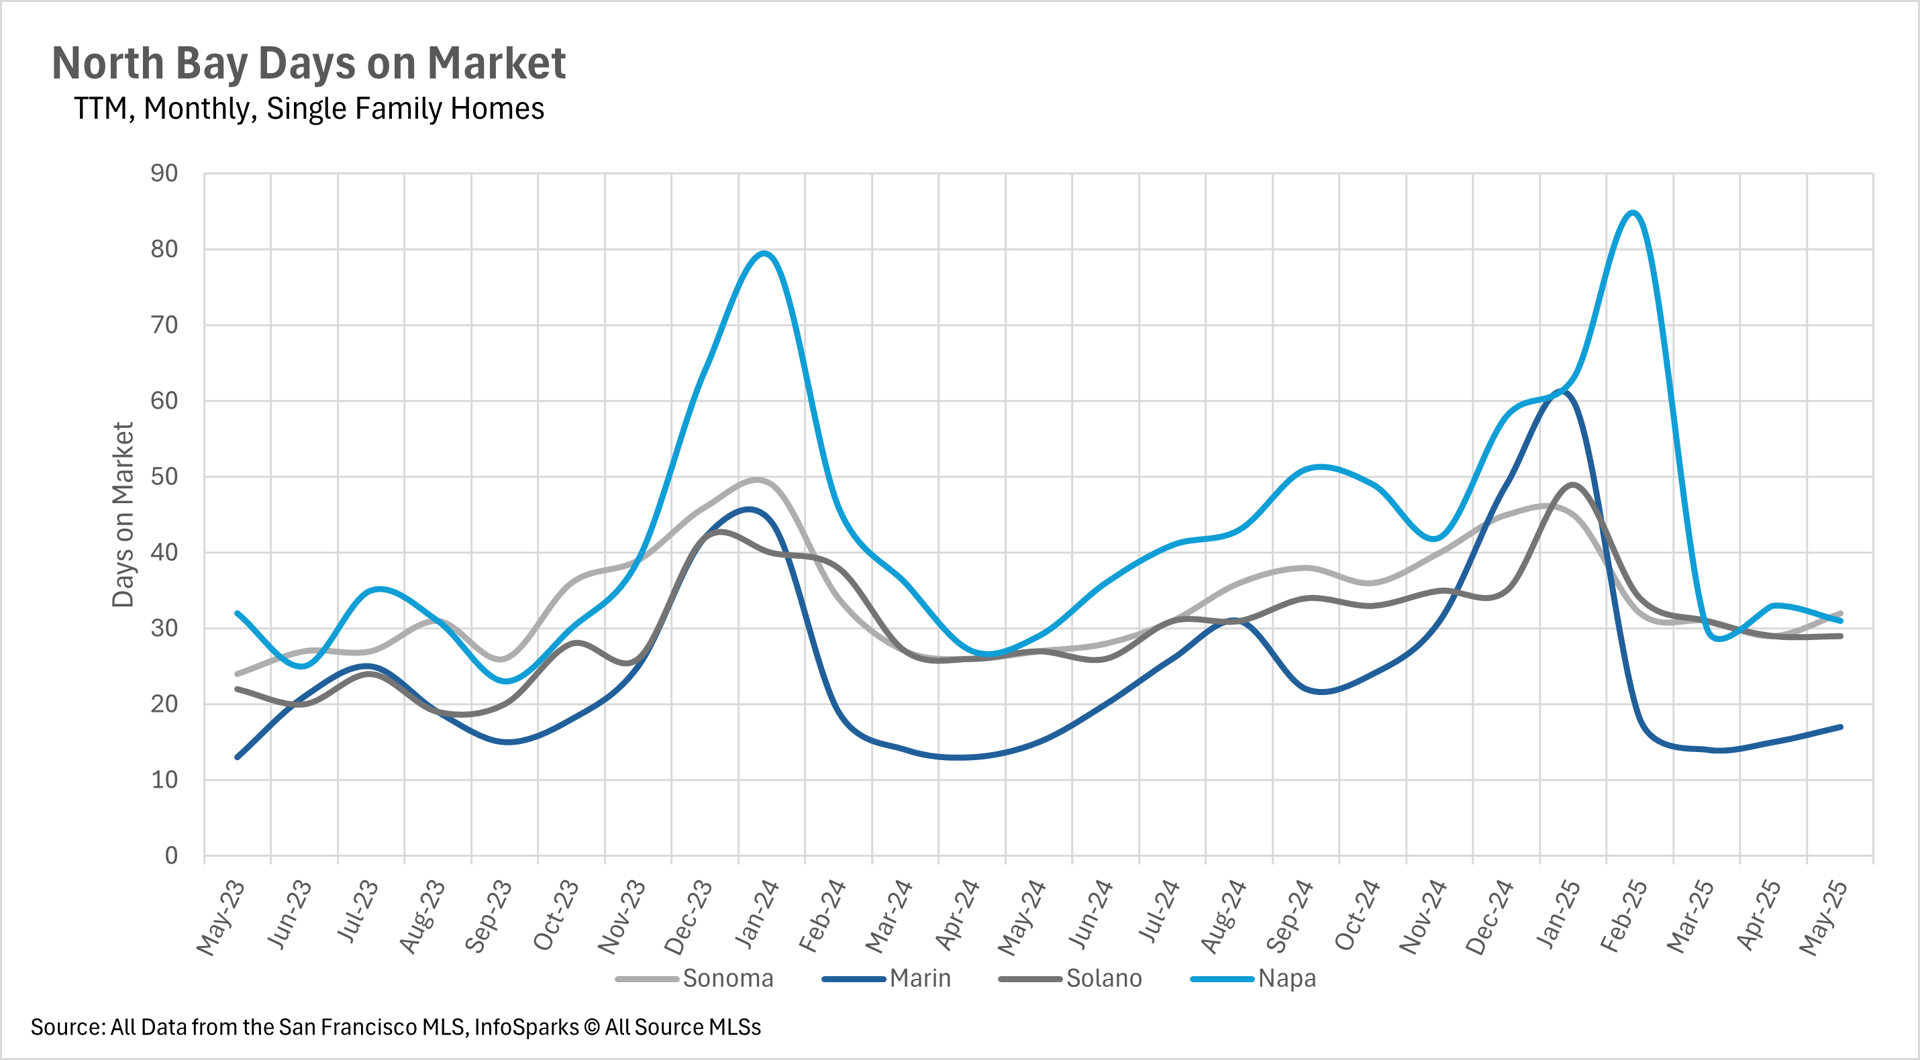
Line chart of North Bay home days on market, by county, from May 2023 to May 2025.

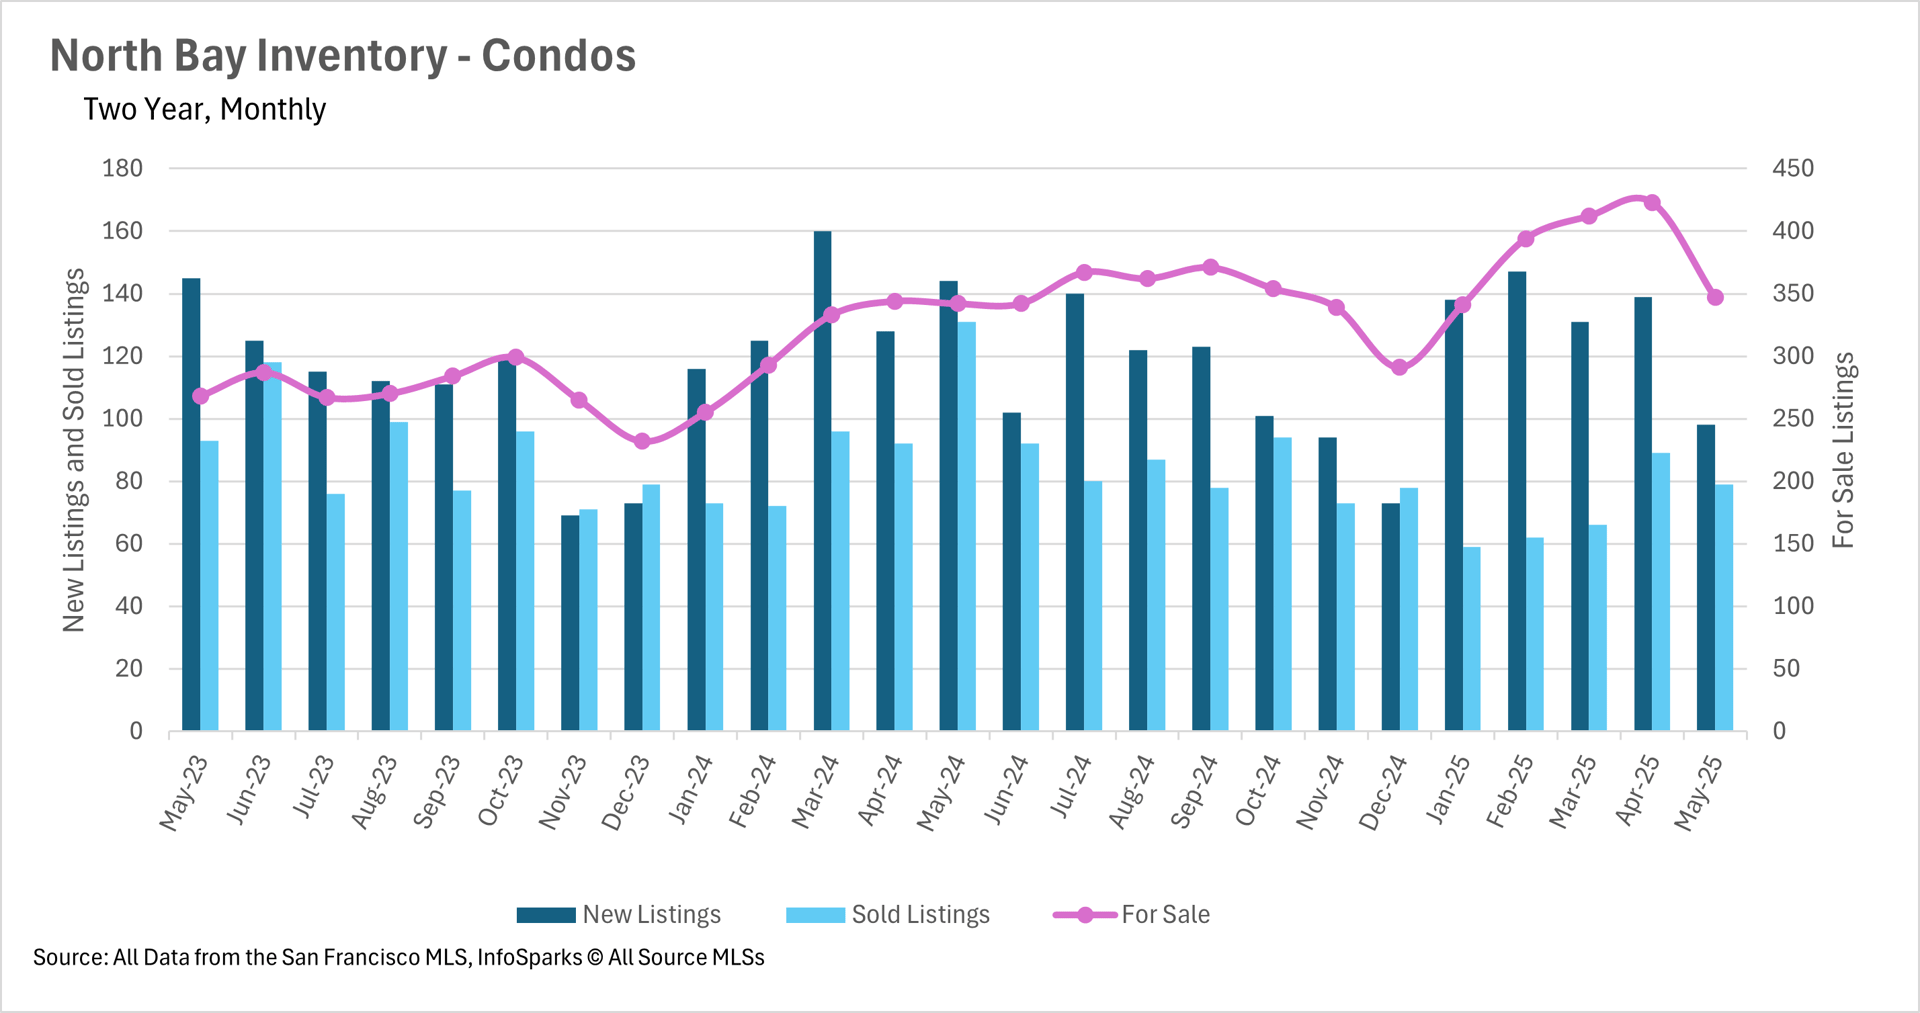
North Bay condo inventory chart comparing monthly new, sold, and for-sale listings from May 2023 to May 2025.

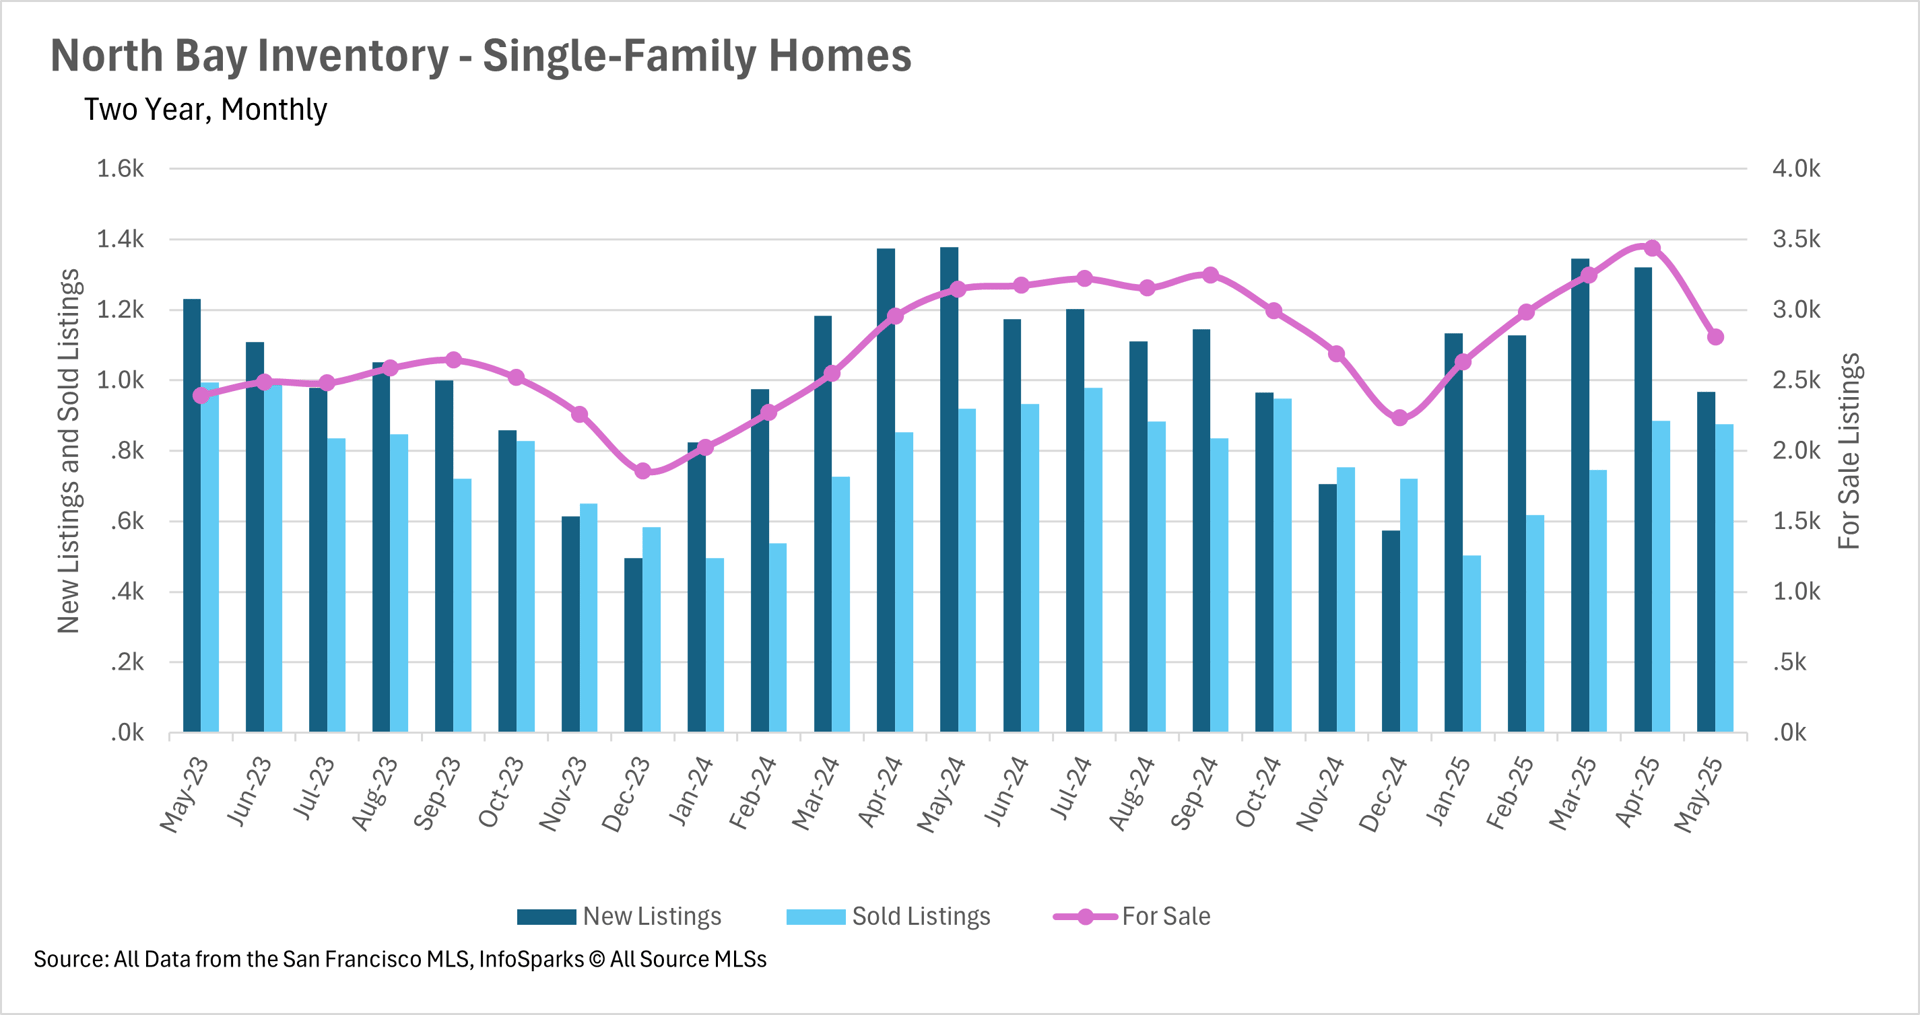
North Bay single-family home inventory chart comparing monthly new, sold, and for-sale listings from May 2023 to May 2025.

Chart of North Bay year-over-year condo price changes, with Napa spiking sharply in February 2025.

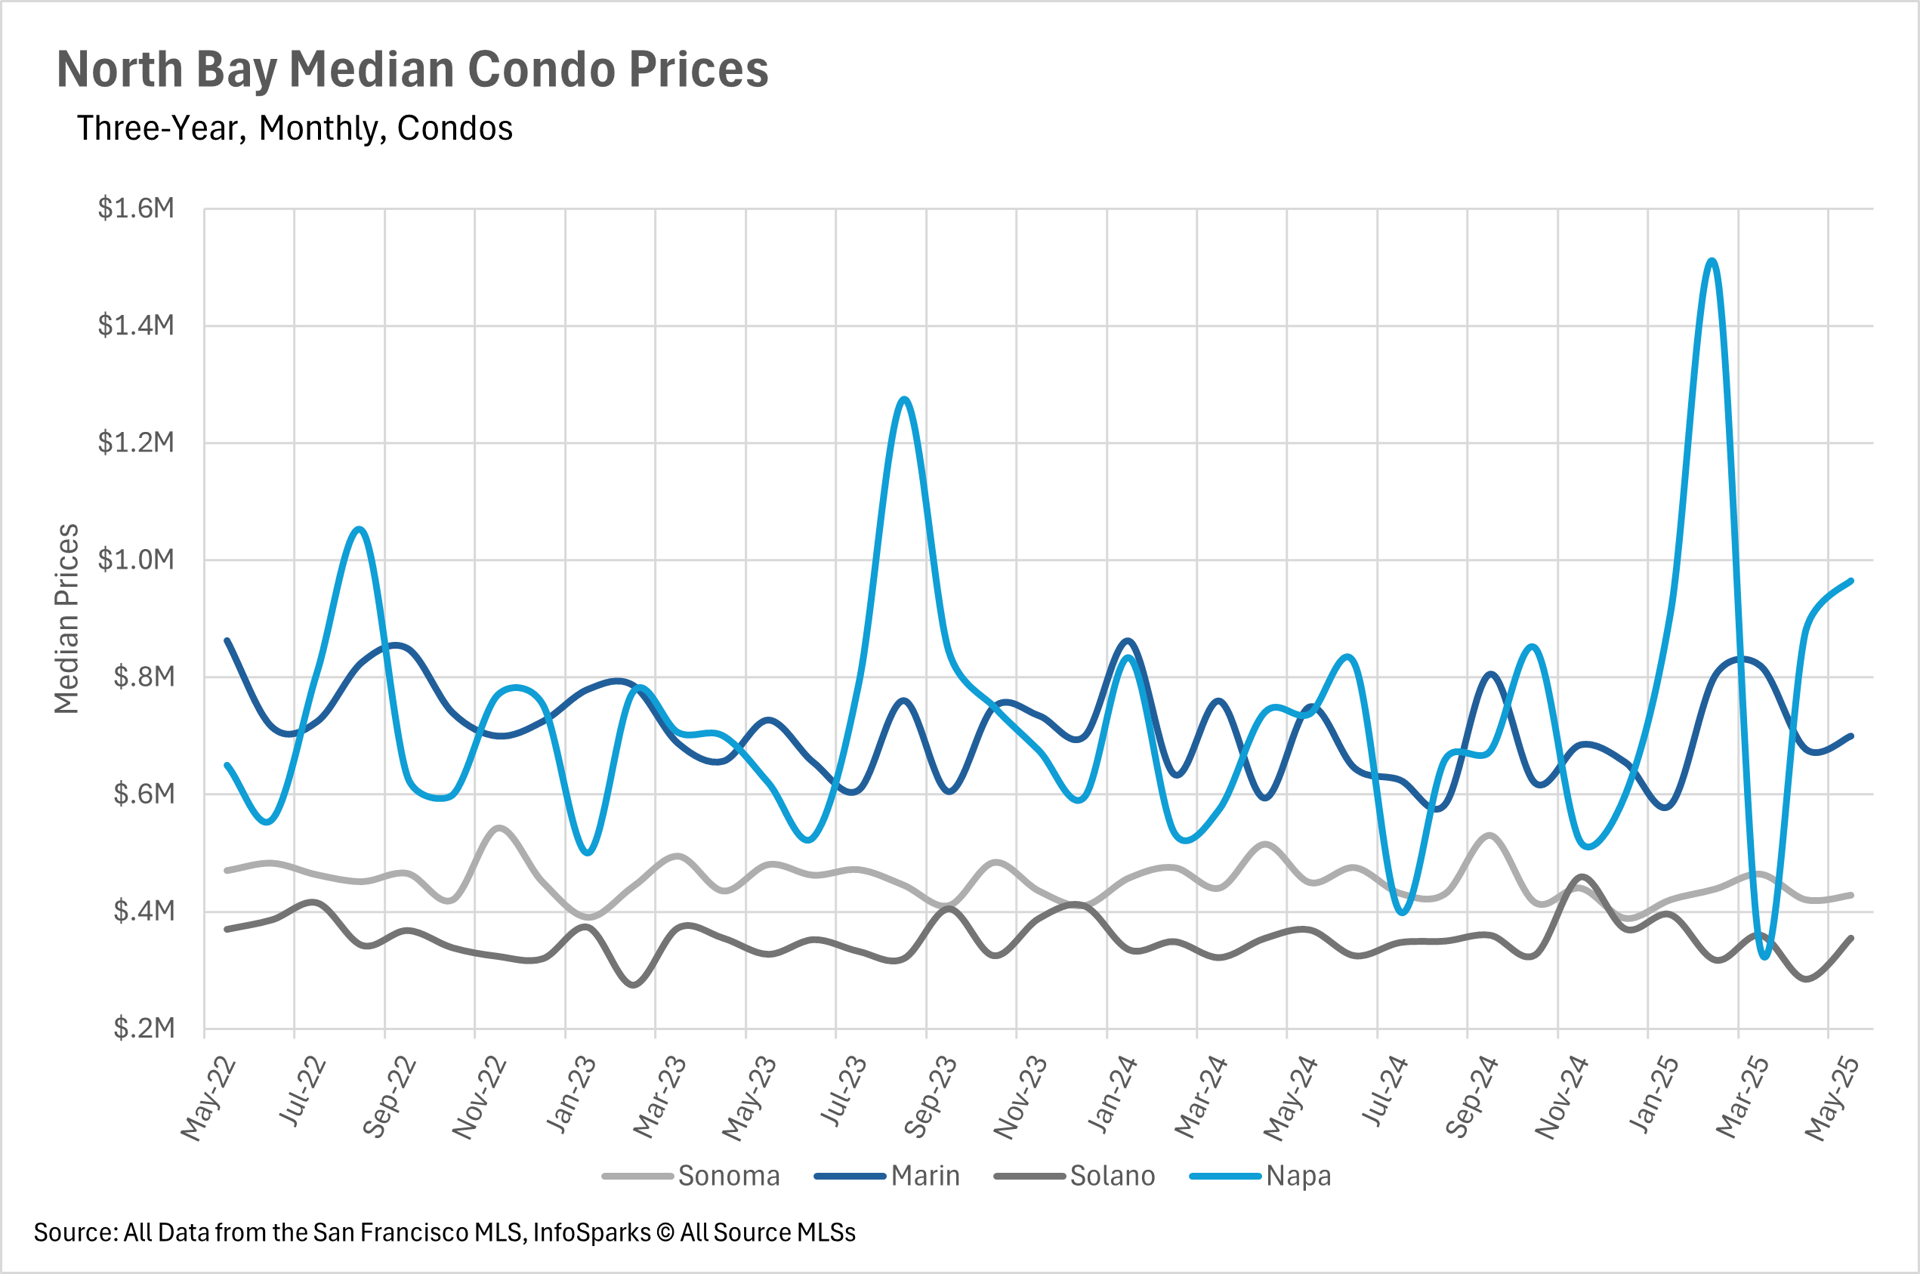
Line chart of monthly median condo prices in Sonoma, Marin, Solano, and Napa counties, May 2022–May 2025.

Chart comparing year-over-year single-family home price changes in four North Bay counties, June 2024 to May 2025.

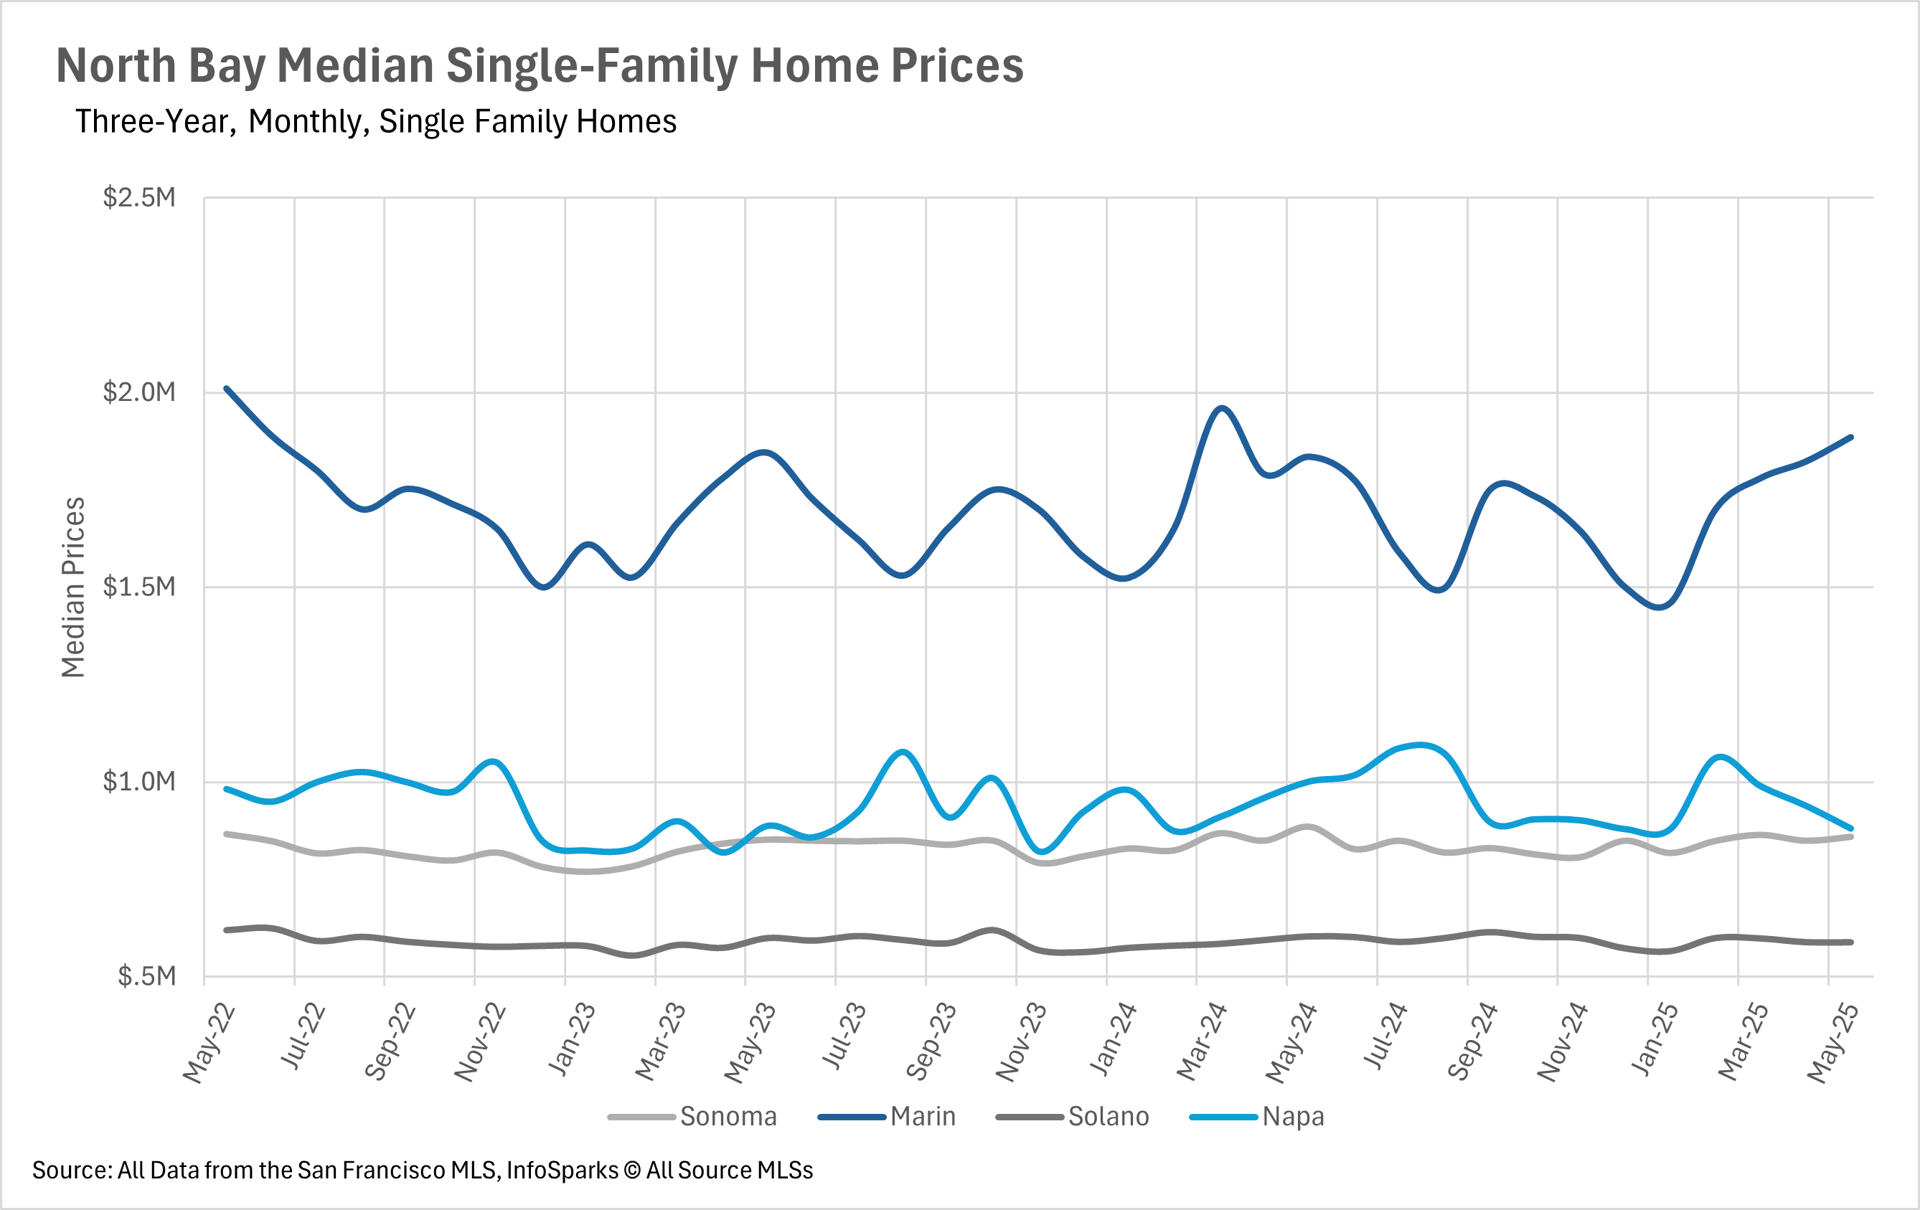
Line chart of monthly median single-family home prices in four North Bay counties, May 2022–May 2025.

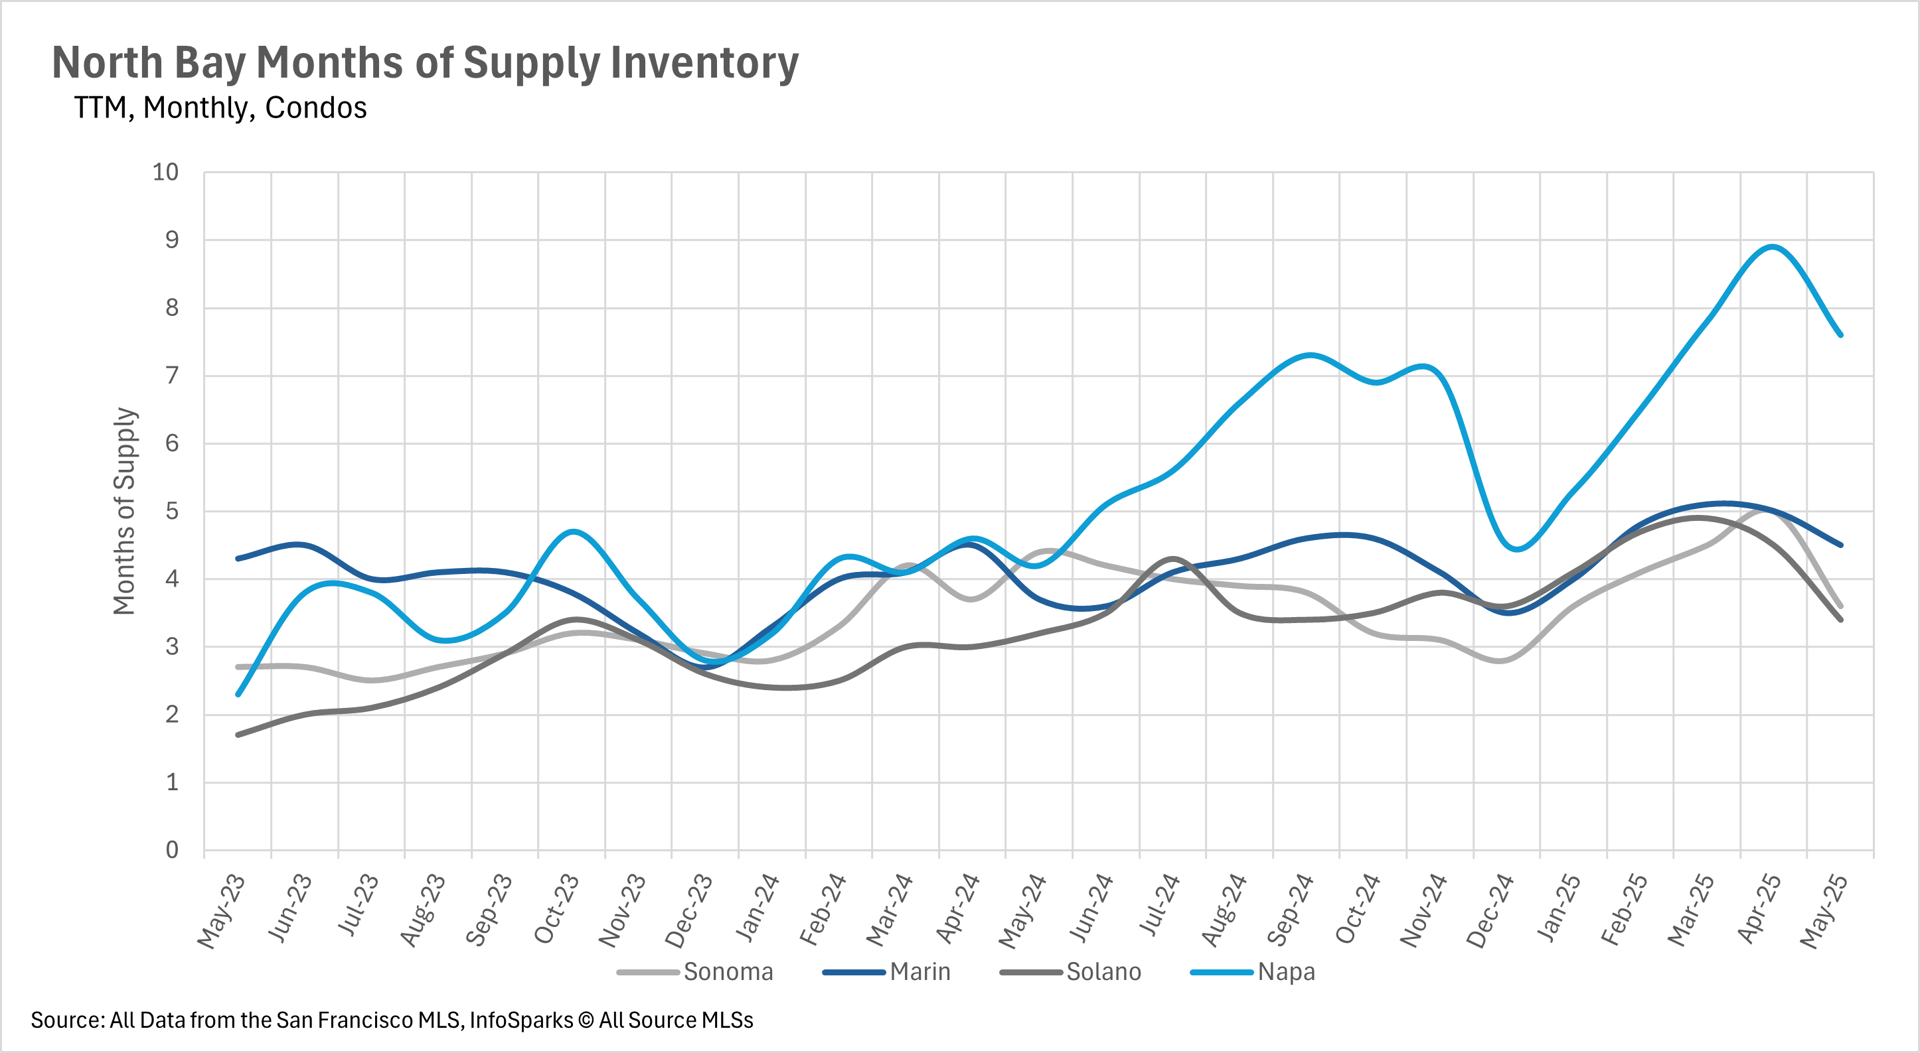
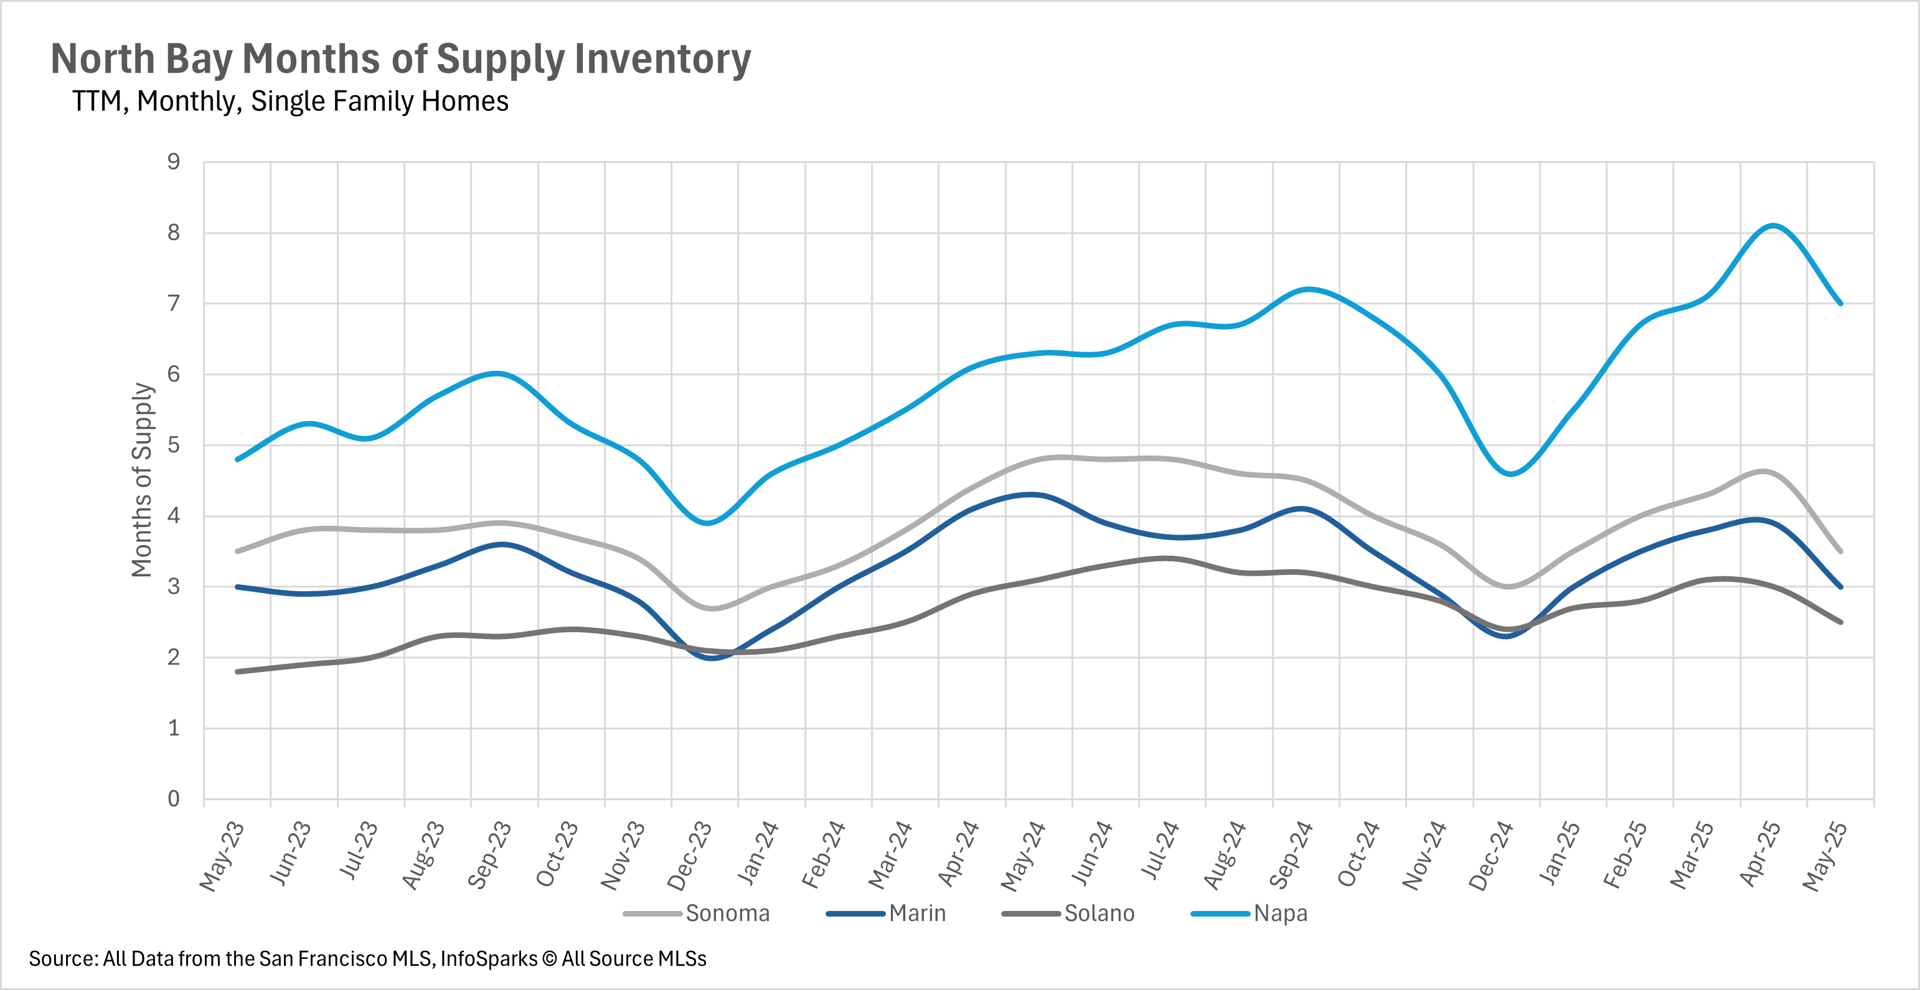
North Bay condo months-of-supply chart, comparing Sonoma, Marin, Solano, and Napa from May 2023 to May 2025.Line chart of monthly North Bay single-family home supply for Sonoma, Marin, Solano, and Napa, May 2023–May 2025.

SILICON VALLEY

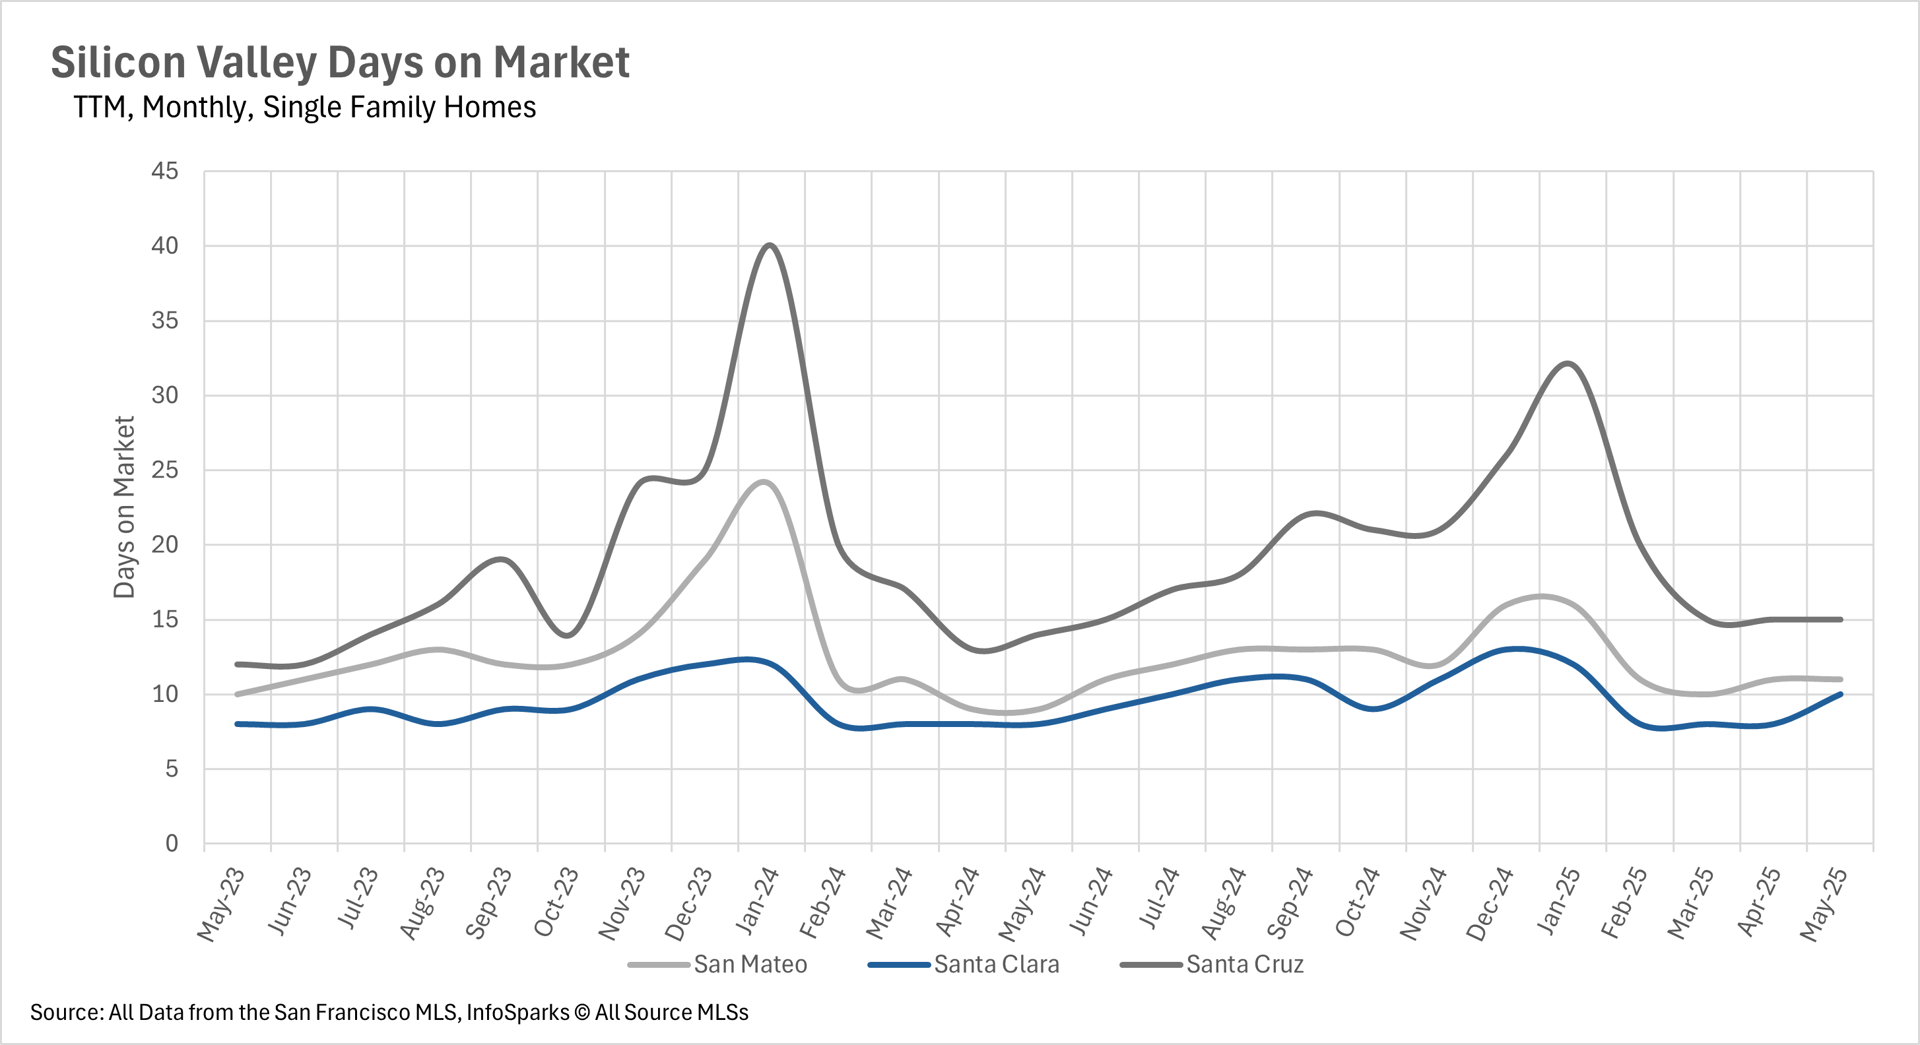
Line chart comparing monthly single-family home days on market in San Mateo, Santa Clara, and Santa Cruz, May 2023–May 2025.

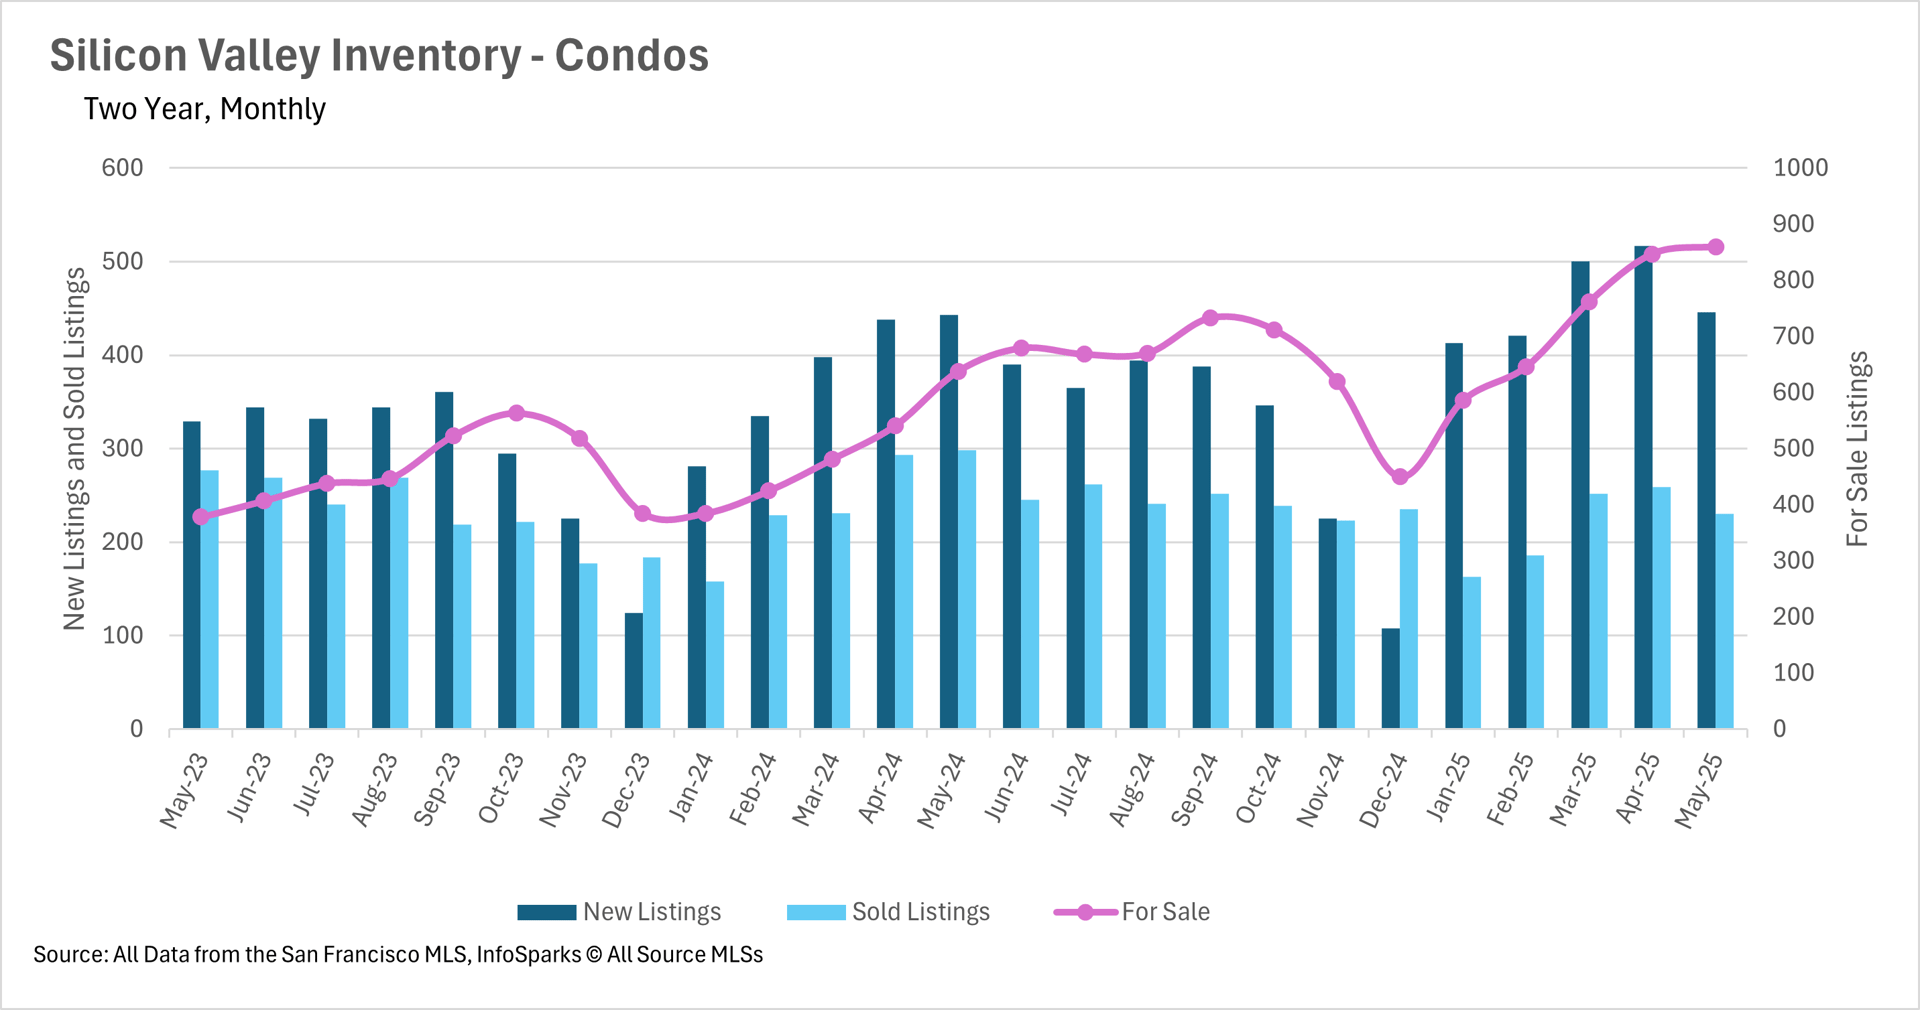
Chart of Silicon Valley condo listings from May 2023 to May 2025, comparing new listings, sales, and inventory.

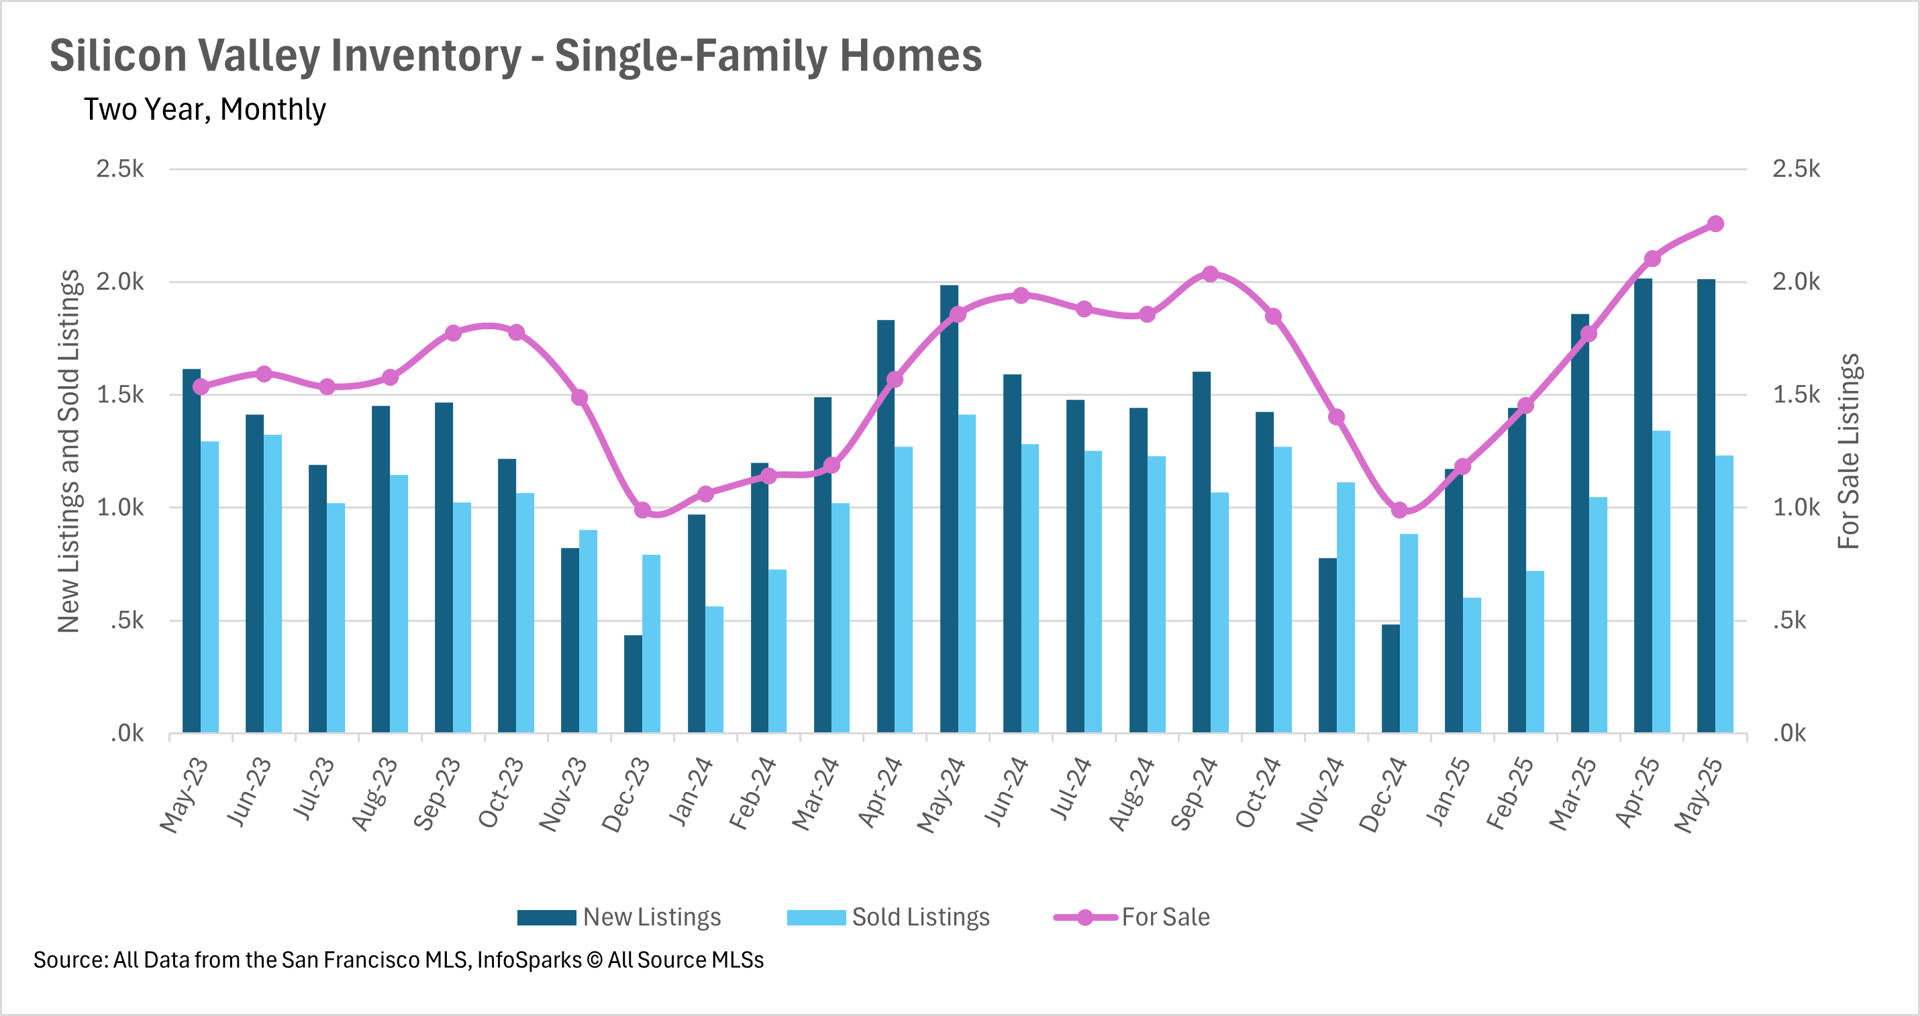
Chart of Silicon Valley single-family home listings and sales, May 2023–May 2025, with inventory peaking in May 2025.

Chart of year-over-year condo price changes in San Mateo, Santa Clara, and Santa Cruz counties, June 2024–May 2025.

Chart of year-over-year Silicon Valley single-family home median price changes by county, June 2024 to May 2025.

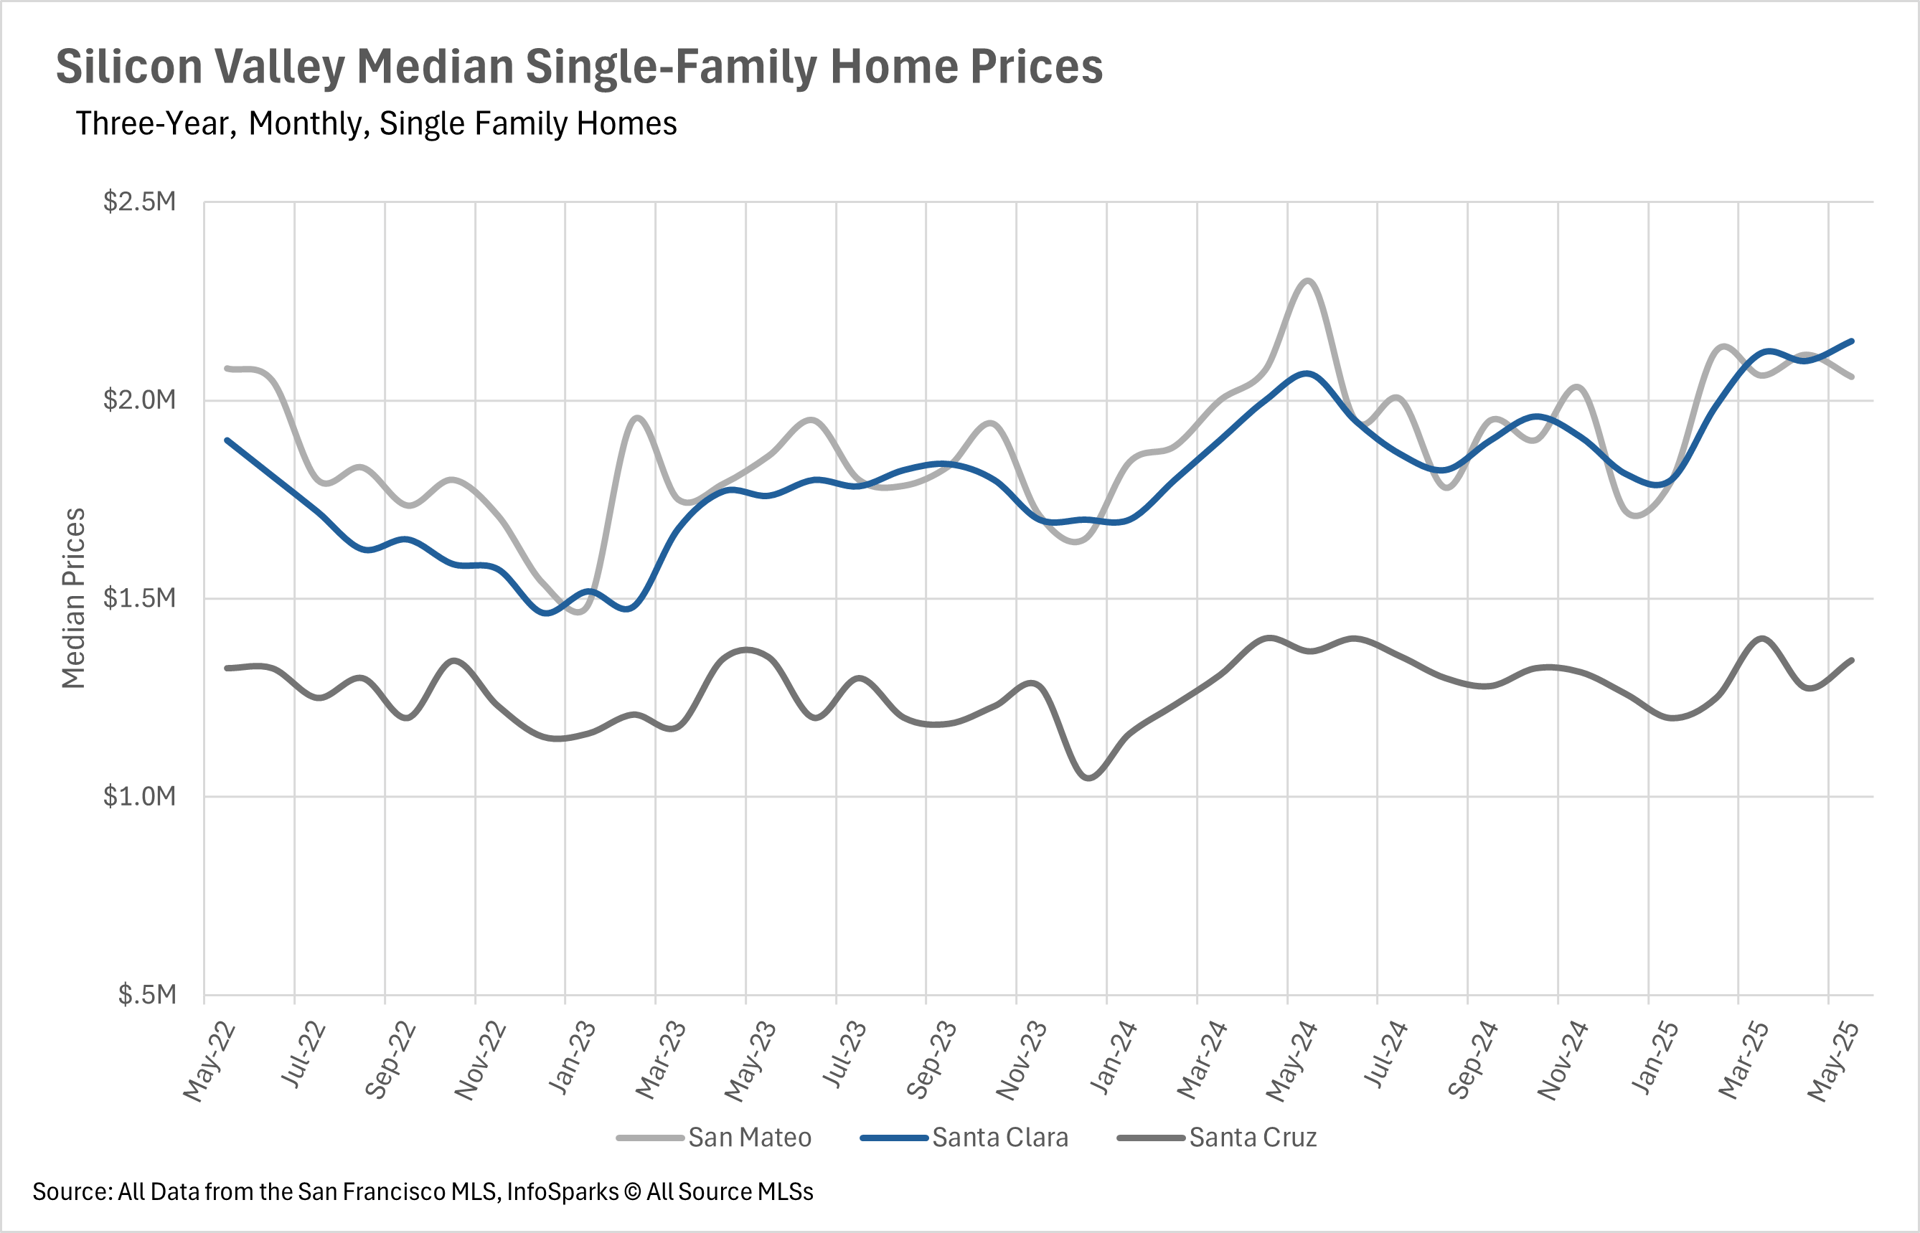
Chart of monthly Silicon Valley single-family home prices by county, May 2022 to May 2025.

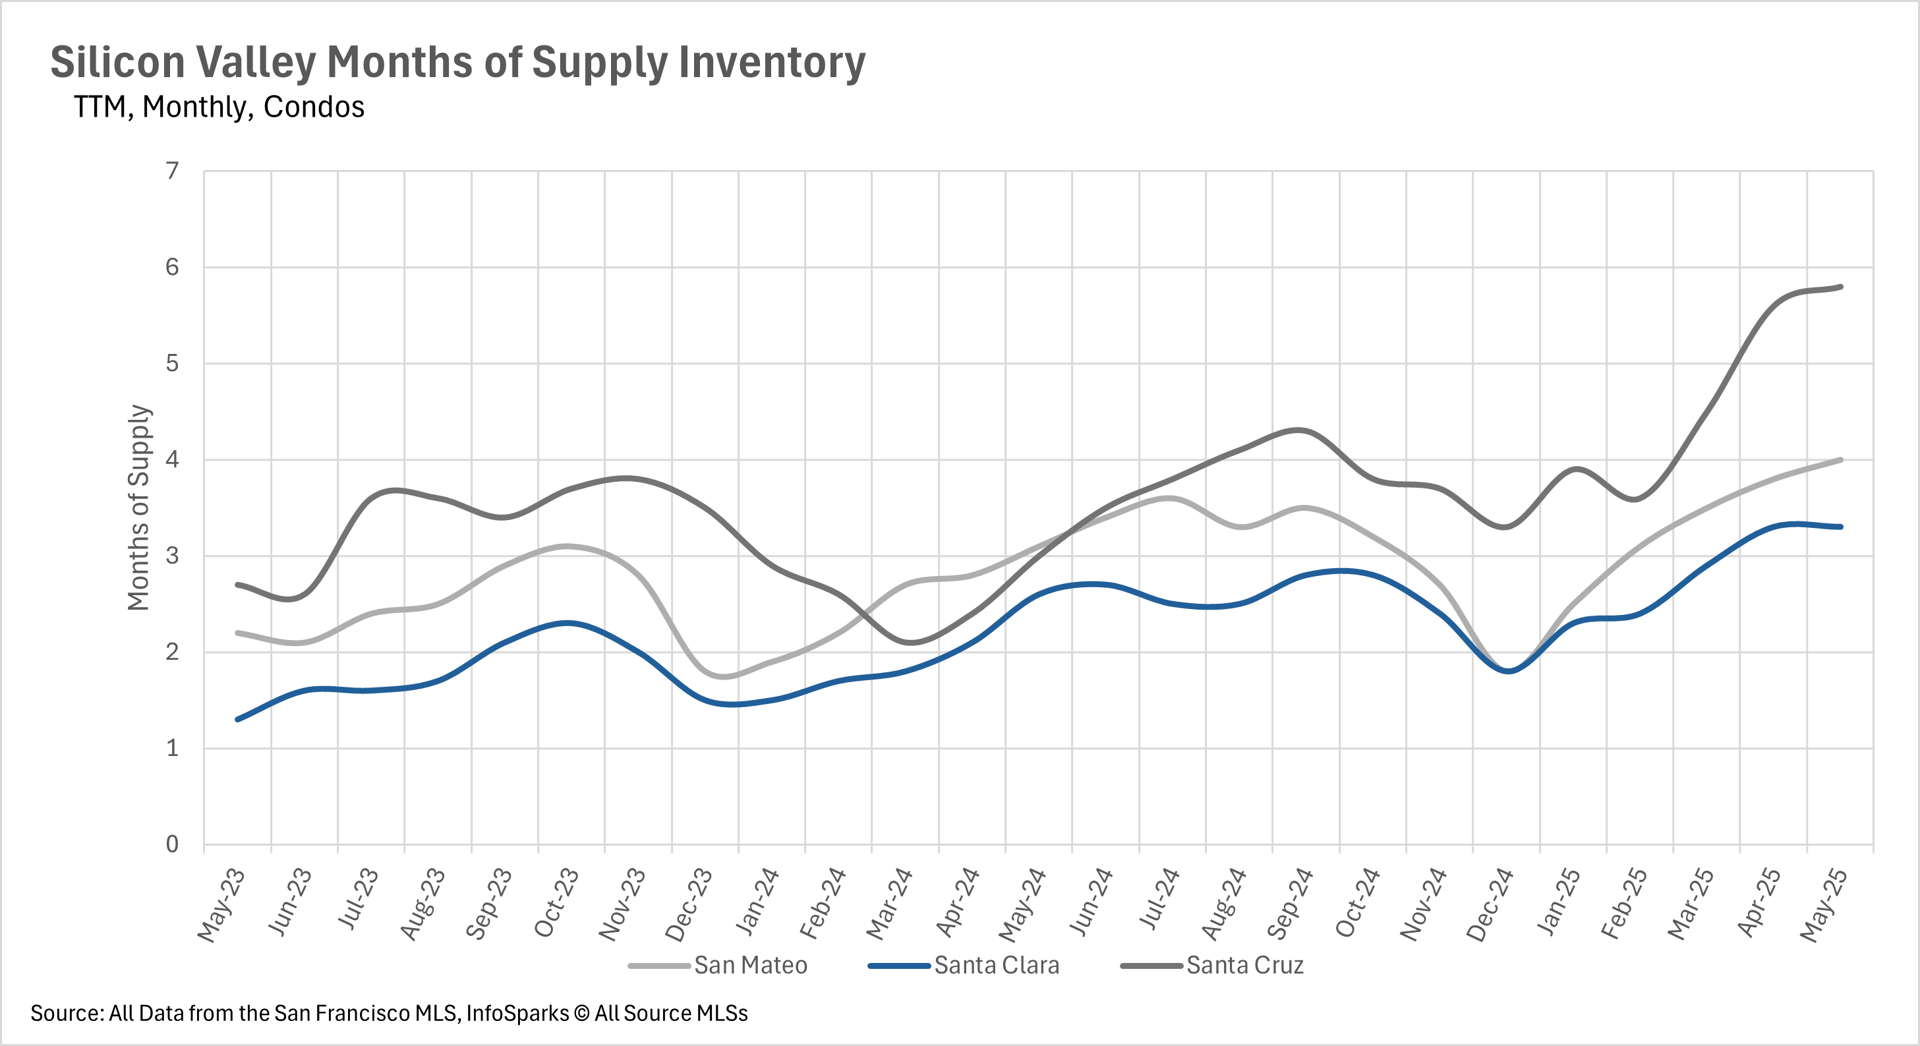
Chart of Silicon Valley condo inventory, with Santa Cruz rising sharply to 5.8 months by May 2025.


Let's Talk

You’ve got questions and we can’t wait to answer them.
Set Up Your Search for New Homes

Check It Out